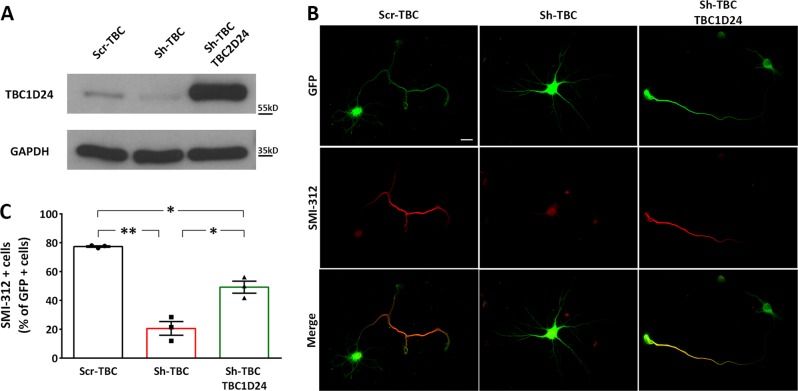
Fig. 2.
Silencing of TBC1D24 impairs axon specification. a Representative western blot showing overexpression of TBC1D24 and its resistance to the Sh-TBC. GAPDH is shown for equal loading. b Representative images of transfected GFP-positive PCNs labelled for the axonal marker SMI-312 (red). Scale bar 20 μm). c The frequency SMI-312-positive neurons is expressed in percent of the total number of GFP-positive cells from 3 independent preparations (60 neurons were analyzed for each experimental group). One-way ANOVA/Bonferroni’s tests: *p < 0.05; **p < 0.001

