Fig. 4.
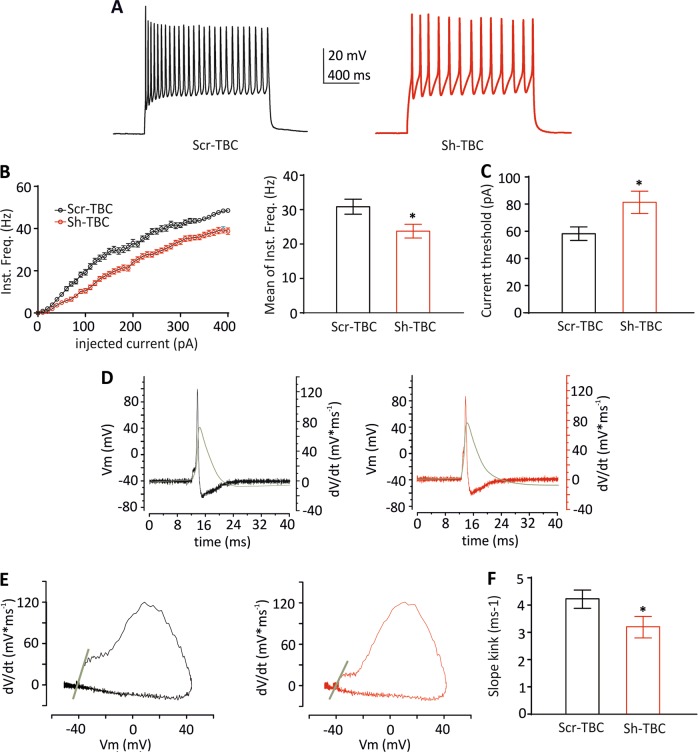
Silencing of TBC1D24 alters neuronal excitability. a Representative current-clamp recordings of spike trains evoked by somatic current injection of + 180 pA for 1 sec in GFP-positive neurons transfected with a Scr-TBC (black) and Sh-TBC (red). b Graphs showing instantaneous firing frequency versus injected current (left) and their averaged values (right). c Graphs showing current threshold. Data are means ± SEM of 29-32 cells from 2 independent preparations. d Representative action potentials (black and red traces for control and TBC1D24-silenced neurons, respectively) superimposed to the time course of the first derivative of the membrane voltage (dV/dt, grey traces). e Representative phase-plane plots of the first derivative of the membrane voltage (dV/dt) versus membrane voltage (Vm). The gray line represents the linear regression of the first 10 data points of the rising phase with a Y-value > 5 mV/ms, used to calculate the slope of the kink at the action potential threshold. f Slope of the phase-plane kink at the action potential threshold. Student’s t test: *p < 0.05

