Fig. 7.
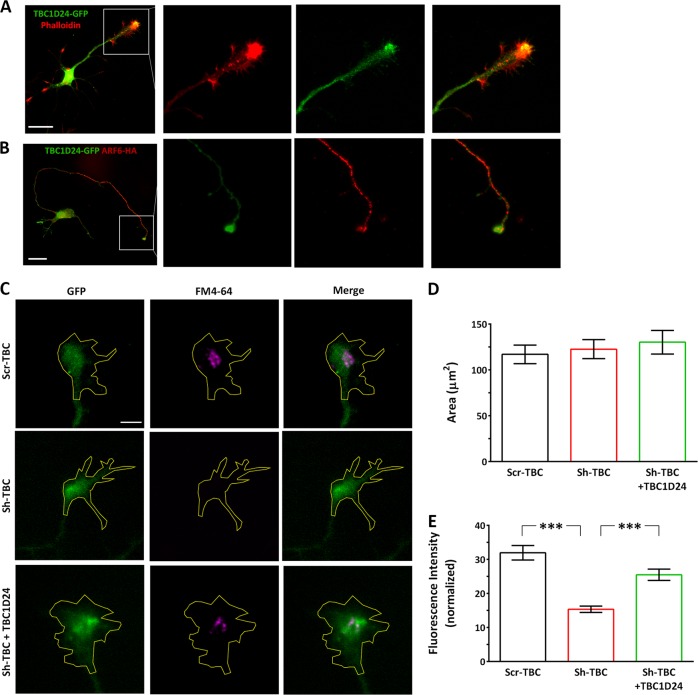
Silencing of TBC1D24 results in membrane trafficking defect at the growth cone. a Representative images of 3 DIV rat PCNs transfected with TBC1D24-GFP (green) and labelled with Alexa Fluor 546 phalloidin (red) to visualize GCs. Scale bar, 20 μm. White square indicates the magnified images on the right show the enrichment of TBC1D24 at the GC central domain. b Representative images of 3 DIV rat PCNs co-transfected with Arf6-HA (red) and TBC1D24-GFP (green). Scale bar, 20 μm. White square indicates the magnified images on the right showing colocalization of Arf6 and TBC1D24 at the GC. c Representative images of GFP-positive GCs from Scr-TBC, Sh-TBC and Sh-TBC/TBC1D24 transfected neurons after FM4-64 loading. Manual tracing of the GC area is shown. Scale bar, 5 μm. d Quantification of the GC area. e Quantification of FM4-64 fluorescence intensity normalized to the area analyzed. Data are means ± SEM of 63-128 PCNs from 3 independent preparations. Kruskal–Wallis/Dunn’s tests: ***p < 0.0001

