Fig. 1.
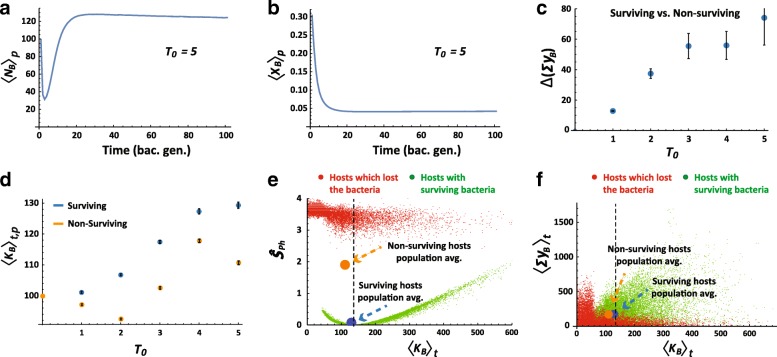
Stress-dependent adjustment of bacterial niche size. a, b Short term kinetics of the population-averaged number of bacteria, <NB >P (a) and bacterial sensitivity, <xB >P (b) for hosts which survived a single pulse of exposure to toxin, T0 = 5, applied at the initial time step. c Average difference ± standard error (SE) between surviving and non-surviving hosts with respect to the total amount of detox secreted by bacteria over a host generation (shown for each T0). d Mean carrying capacity for bacteria in the population of hosts, averaged (± SE) over a host generation at different levels of T0. e Average physiological stress over a host generation, Ŝ Ph, versus the time average of its carrying capacity for bacteria. Green and red points represent hosts with surviving and non-surviving bacteria, respectively. Blue and orange circles mark population averages for surviving and non-surviving hosts, respectively. Dotted line marks carrying capacity which minimizes the physiological stress. f Same as (e) for the time average of total bacterial detox versus bacterial carrying capacity. Time and population averages are denoted by t and p subscripts, respectively)

