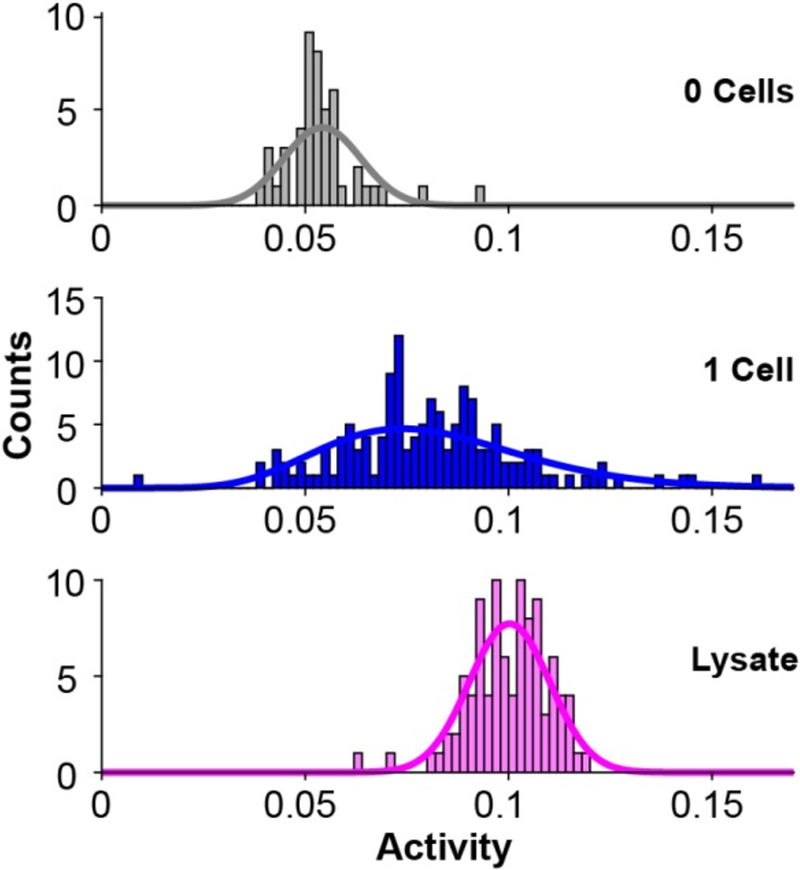
Figure 3.
Histograms showing the distribution of PTP activities in individual cells from a population, with corresponding fits to a gamma distribution. A control experiment where no cells were added to the wells (48 wells, gray) reveals a background level of measured activity. An experiment to measure activities in individual cells reveals a broad distribution (143 single cells, blue), and a control experiment that measures activities in an identical homogenous lysate (96 wells, pink) reveals the technical variance in the assay, and demonstrates that a significant fraction of the distribution in the analysis of a cell population is due to variation in PTP activity.

