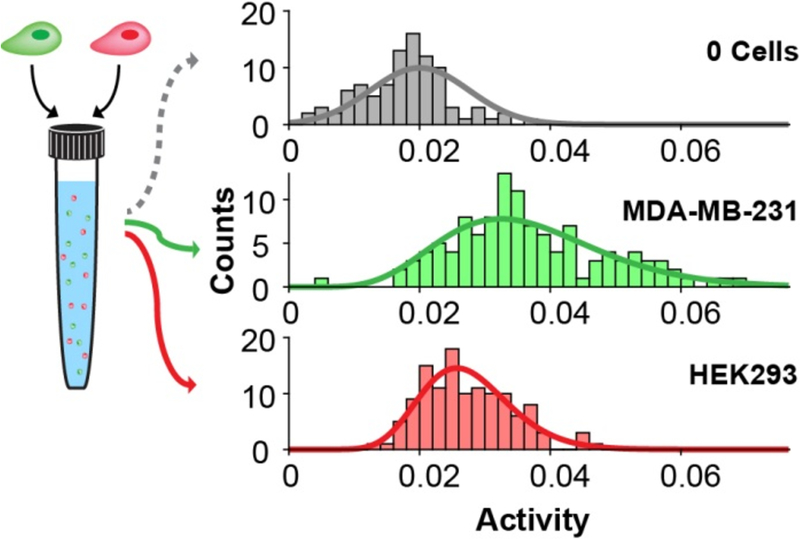
Figure 4.
SAMDI analysis of the distribution of activities in a mixed population of cells. MDA-MB-231 cells (labeled with CellTracker™ Green CMFDA) and HEK293 cells (labeled with CellTracker™ Red CMPTX) were mixed into a single suspension. The top histogram shows the distribution of measurements of the background (0 cells) and a fit to a normal distribution (gray line). The green and red histograms show the distributions of single-cell activities measured from MDA-MB231 and HEK293 cells, respectively, sorted with fluorescence gating, and the lines represent gamma distribution fits.

