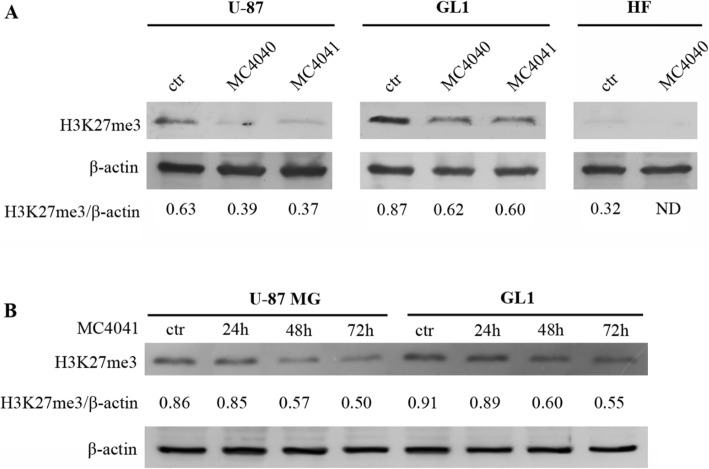
Fig. 5.
a Western blot of U-87, GL1 and HF treated with DMSO (ctr) or with 25 μM MC4040 and MC4041 for 72 h showing H3K27me3 and β-actin levels. The means from densitometry quantifications of three different experiments normalized to β-actin are indicated below each band. ND, not detectable. b Time-course experiment performed treating U-87 and GL1 cells with MC4041 (25 μM) for 24, 48, and 72 h. The levels of H3K27me3 are shown (mean from three different experiments) and have been normalized to β-actin

