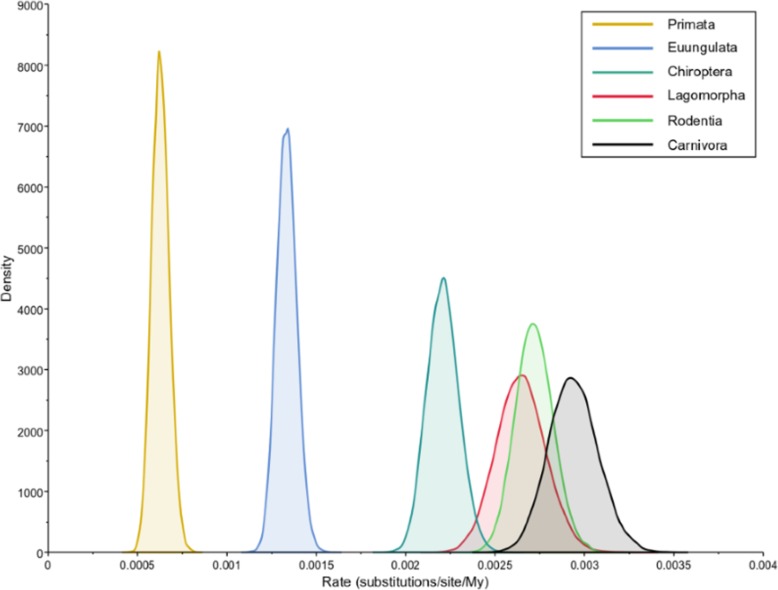
Fig. 2.
Bayesian estimates of evolutionary rates for mammalian lineages. Posterior density distribution of the inferred evolutionary rates for the six studied mammalian lineages: Chiroptera, Lagomorpha, Rodentia, Carnivora, Euungulate and Primata. The rates were inferred using BEAST software [16] under a fixed local clock model [17]

