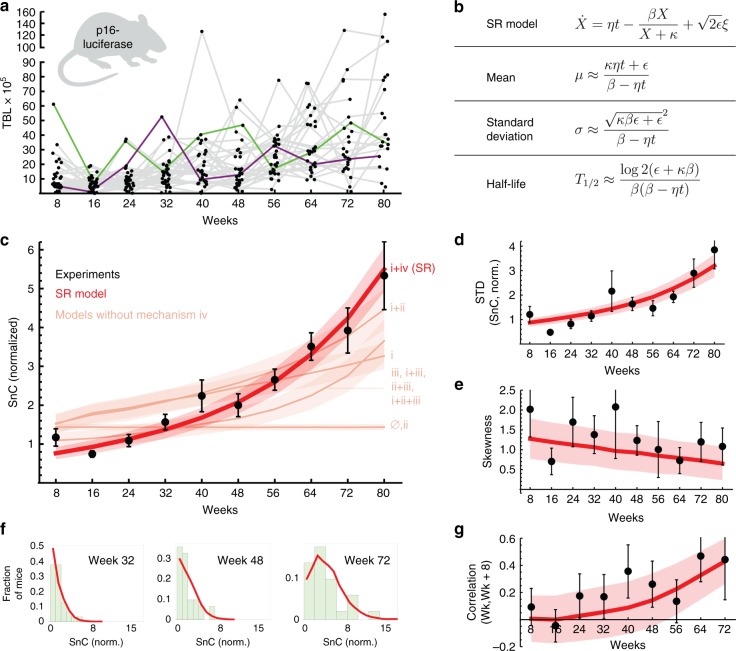
Fig. 2.
Saturated-removal (SR) model captures longitudinal SnC trajectories in mice. a Total body luminescence (TBL) of p16-luciferase in mice (n = 33). Gray lines connect data from the same individual mice (green and purple lines are examples of individual trajectories). b SR model equations and their approximate analytical solutions. The SR model (red line) captures c the mean SnC abundance, d standard deviation of SnC abundance, e skewness, and f shape of the distributions among equal-aged individuals, and g correlation between subsequent measurements on the same individuals. TBL was normalized to give a mean abundance of 1 at young ages. Maximum-likelihood parameters for the SR model are: η = 0.15 day−1 year−1, β = 0.27 day−1, κ = 1.1, ε = 0.14 day−1. Pink lines in c: best-fit of all models without saturation mechanism iv, that have an age-related increase in SnCs, best-fit parameters are in Supplementary Note 1. Mean and standard error (shaded red, pink regions) are from bootstrapping. Source data are provided as a Source Data file.

