Fig. 3.
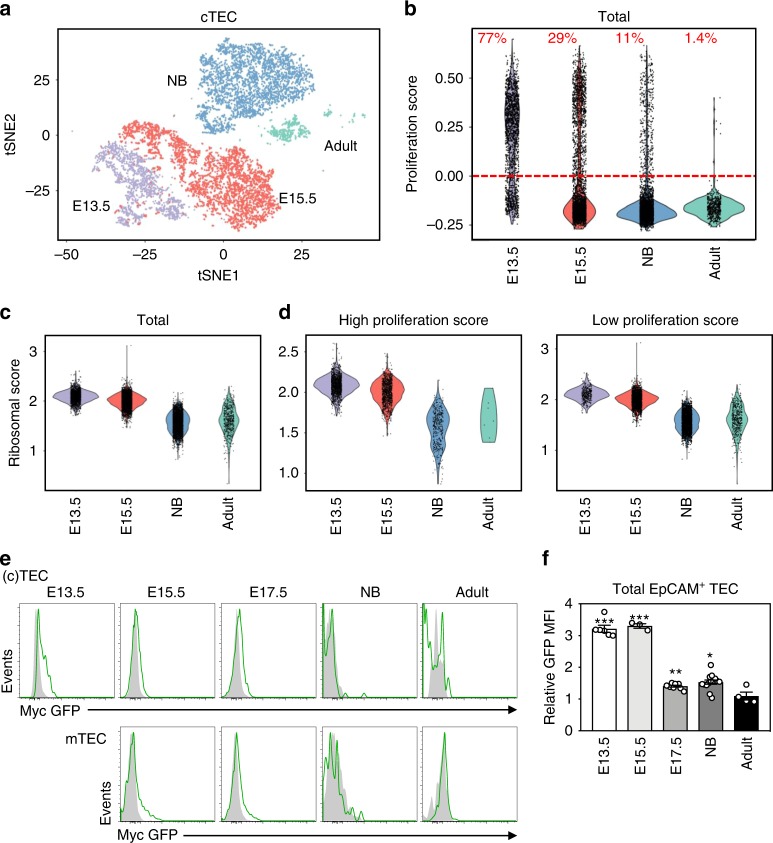
A decline in Myc activity and protein levels in TEC during fetal development. Single-cell RNA-seq analysis of cell sorted total TEC (CD45−EpCAM+) from embryonic day 13.5 (E13.5, purple) and cTEC (CD45−EpCAM+Ly51+UEA−) from embryonic day 15.5 (E15.5, pink), newborn (NB, blue) and adult (green) mice. a A t-SNE plot of TEC populations, colored and clustered by indicated ages; each dot is a cell. b A violin plot of the proliferation score applied to cells at each indicated timepoint. The red line separates cells with a high proliferation score above the line and a low proliferation score below the line; percentages of cells above the line are indicated in red. Violins plots of the ribosomal score applied to total cells (c), or cells with a high proliferation and low proliferation score (d) at indicated timepoints. e Myc-GFP levels displayed as histogram gated on CD45-EpCAM+ total TEC from E13.5, or cTEC (CD45−EpCAM+Ly51+UEA−) (above) and mTEC (CD45−EpCAM+Ly51−UEA+) (below) subsets from homozygote GFP-c-Myc knock-in mice at each indicated age, overlaid on litter mate WT GFP-c-Myc knock-in controls (filled gray histograms). f Bar graph represents the relative Myc-GFP MFI against WT aged matched controls in total CD45−EpCAM+ total TEC at each indicated timepoint. Bar graphs show mean ± SEM for a minimum n = 3 mice per age. A two-tailed unpaired Student’s t test was performed to determine significance. *p < 0.05, **p < 0.01, ***p < 0.001. The source data underlying (f) are provided as a Source Data file.

