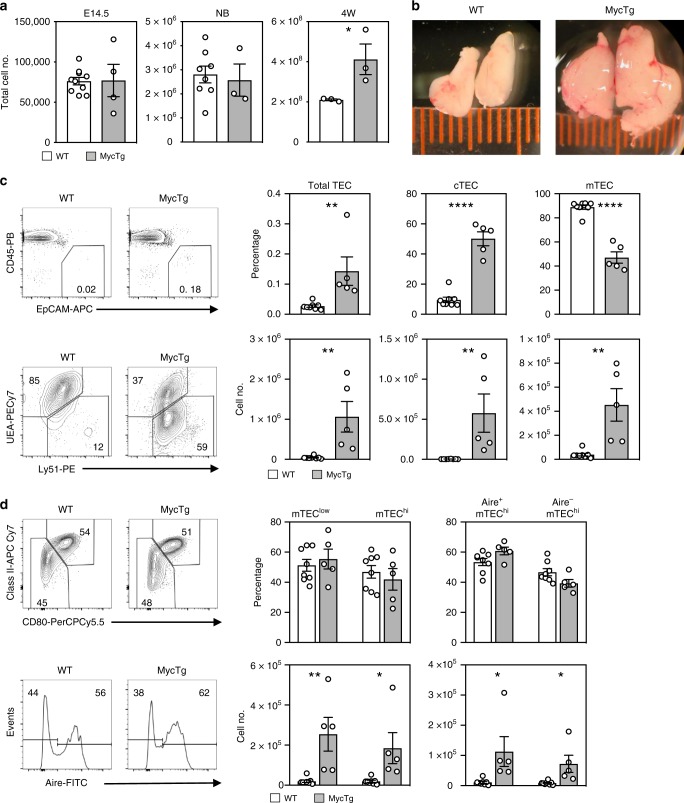
Fig. 4.
Transgenic expression of Myc in TEC drives thymic growth. a Total thymus counts of WT (white bars) or FoxN1MycTg (gray bars) mice at embryonic day 14.5 (E14.5), newborn (NB) or 4 weeks of age. b Photographs of 10-week-old thymi from WT (left) or FoxN1MycTg (right) mice. c Representative flow plots of the frequency of CD45− EpCAM+ total TEC (above), or Ly51+ UEA− cTEC and Ly51− UEA+ mTEC pre-gated on CD45− EpCAM+ total TEC (below), from 4-week-old WT or FoxN1MycTg mice. Bar graphs display the frequency (above) or cell number (below) of total TEC (left), cTEC (middle) or mTEC (right) of adult WT or FoxN1MycTg mice. d Representative flow plots of CD80+ ClassII+ mTEChi or CD80−ClassIIlow mTEClow, pre-gated on Ly51− UEA+ mTEC, or histograms displaying the frequency of Aire+ and Aire− cells pre-gated on CD80+ ClassII+ mTEChi from WT or FoxN1MycTg mice. Bar graphs display the frequency (above) or numbers (below) of the corresponding populations. All bar graphs show mean ± SEM for a minimum n = 3 mice per genotype. A two-tailed unpaired Student’s t test was performed to determine significance. *p < 0.05, **p < 0.01, ****p < 0.0001. The source data underlying (a), (c), (d) are provided as a Source Data file.

