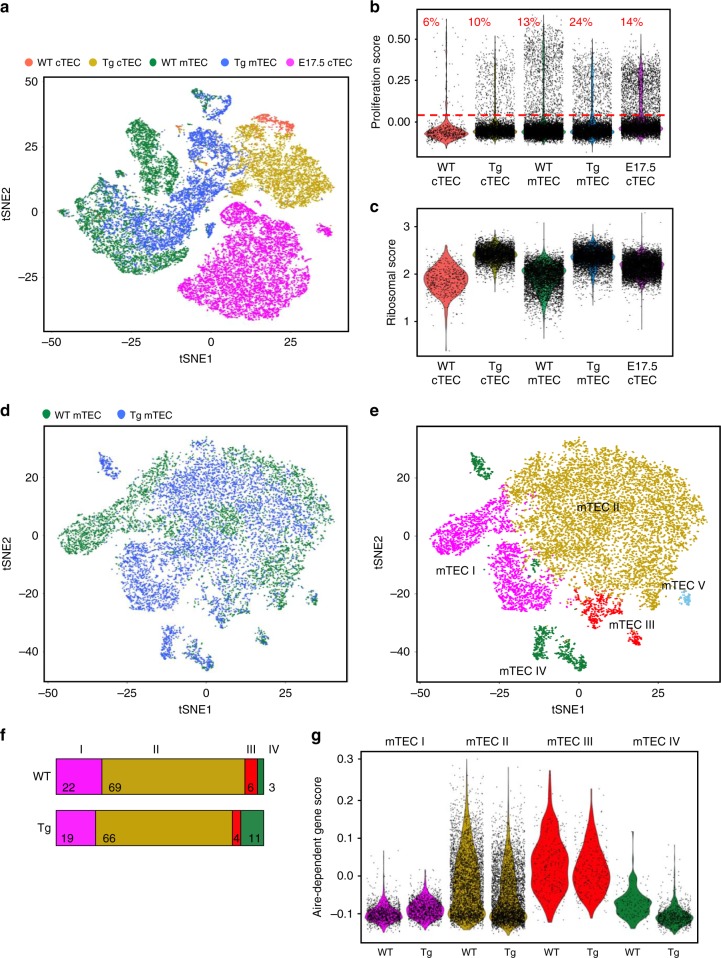
Fig. 5.
Transgenic Myc confers expression of a limited set of fetal-specific genes in adult TEC. scRNA-seq analysis performed on cTEC (CD45−EpCAM+Ly51+UEA−) or mTEC (CD45−EpCAM+Ly51−UEA+) isolated from adult WT or FoxN1MycTg mice, and a cTEC sample from embryonic day 17.5 (E17.5 cTEC). a A t-SNE representation of the populations, colored and clustered by original identity. b A violin plot of the proliferation score for the indicated populations. The red line separates cells based on their proliferation score, high score above the line and low score below the line, percentages of cells above the line are indicated in red. c A violin plot of the ribosomal score applied to the indicated populations. d, e A t-SNE representation, regressed out for cell cycle, of WT and FoxN1MycTg mTEC populations, colored and clustered by original identity (d) or gene expression similarity (e). f The fraction of four (of the five) mTEC clusters identified in (e), for WT mTEC (above) or FoxN1MycTg mTEC (below) samples. The colors of the bars correspond to colors allocated to the four clusters in the t-SNE plot displayed in (e). g A violin plot of the Aire-dependent gene score of either the WT or FoxN1MycTg cells that make up each of the four indicated mTEC subsets.

