
Fig. 6.
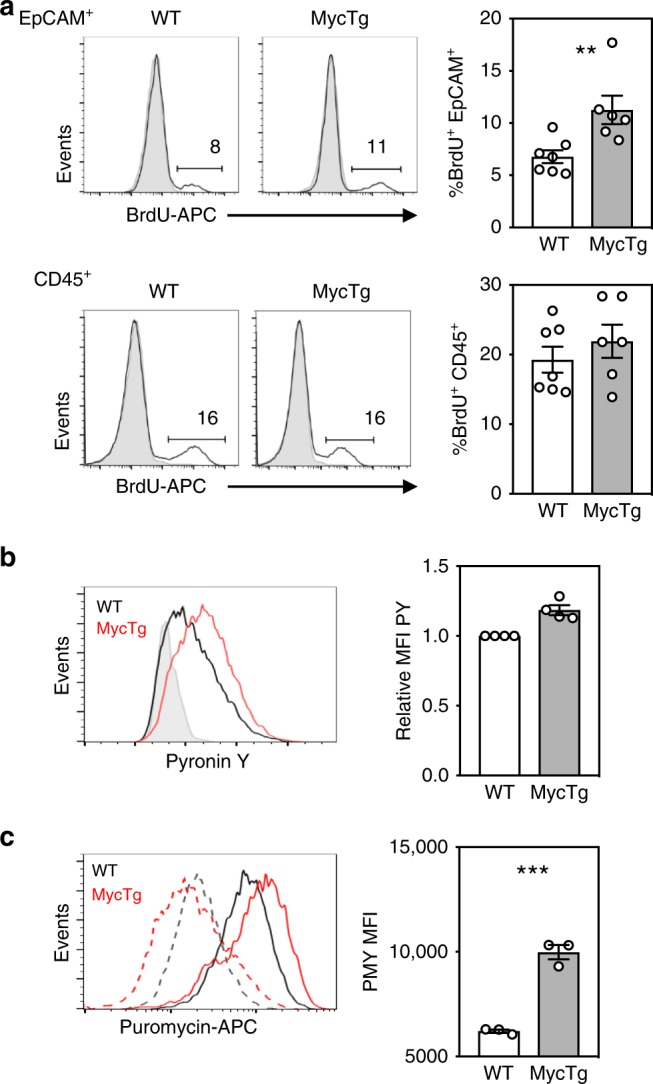
Myc expression increases the frequency of proliferating TEC and the number of actively translating ribosomes. a Representative histograms and bar graphs of the frequency of BrdU+ CD45− EpCAM+ total TEC (above) or BrdU+ CD45+ EpCAM− total thymocytes (below) in adult WT or FoxN1MycTg mice. Gray lines on histograms represent the negative control. b A histogram of pyronin Y staining on CD45−EpCAM+ total TEC populations from WT adult (black line) or FoxN1MycTg adults (red line), overlaid against an adult WT sample treated with RNAse (gray line). Bar graph represents pyronin Y MFI relative to the adult WT control, which is set to 1 in all experiments and so has no error bar. c A histogram of puromycin antibody staining on CD45− EpCAM+ total TEC from adult WT (black) or FoxN1MycTg (red) mice treated with either puromycin (PMY) plus cxcycloheximide (CHX) staining (solid lines) or puromycin plus harringtonine (HNT) (dotted lines). Bar graph represents the MFI of puromycin (PMY) gated on total TEC from WT adult or FoxN1MycTg adults, calculated from the MFI of PMY + CHX treated mice, from which we subtracted the MFI from PMY + HNT treated mice to eliminate the signal associated with stalled ribosomes. All bar graphs show mean ± SEM for a minimum of n = 3 mice per genotype. A two-tailed unpaired Student’s t test was performed to determine significance. **p < 0.01, ***p < 0.001. The source data underlying figures are provided as a Source Data file.