Fig. 2.

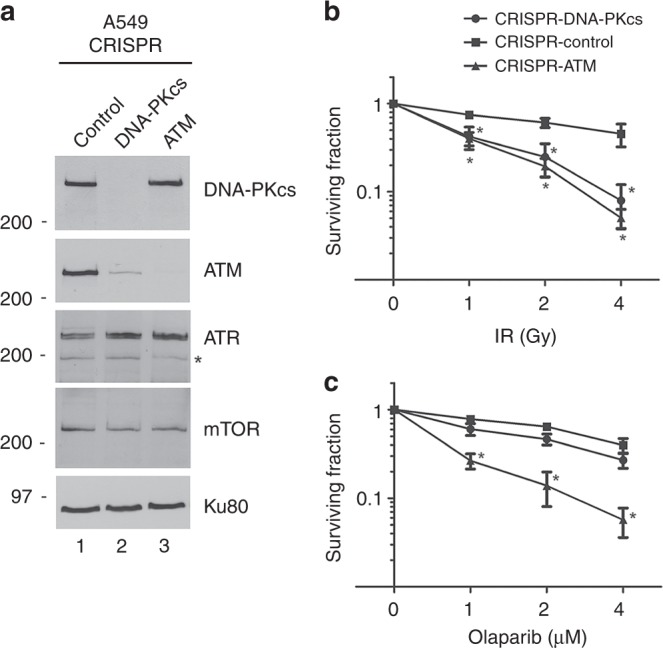
Characterisation of A549 cells with CRISPR/Cas9 depletion of ATM or DNA-PKcs. a Total cell extracts were prepared from A549-CRISPR-control, A549-CRISPR-DNA-PKcs cells and A549-CRISPR-ATM cells by NETN lysis. Fifty µg total protein was run on SDS-PAGE and membranes were immunoblotted for DNA-PKcs, ATM, ATR, mTOR and Ku80 (loading control) as shown on the right-hand side. The asterisk indicates a non-specific band. Positions of molecular weight markers in kDa are shown on the left-hand side. A list of antibodies used in the study are provided in Supplementary Table 2. Bands were quantitated and normalised to Ku80 as described in Supplementary Methods. The level of ATM expression in A549-CRISPR-DNA-PKcs cells was 17% of that in A549-CRISPR-control cells while the level of DNA-PKcs in A549-CRISPR-ATM cells was 93% that in control cells. Results are from 2 separate experiments. b, c A549-CRISPR-control, CRISPR-ATM and CRISPR-DNA-PKcs cell lines were treated with increasing doses of IR (b), or increasing concentrations of olaparib (c), and analysed by clonogenic survival assays as described in Methods. Results show the average of three separate experiments with each treatment carried out in triplicate. Statistical significance was determined using one-way ANOVA. Error bars represent SEM, and * indicates a p-value < 0.05 when compared to the control A549 cell line at the indicated time points
