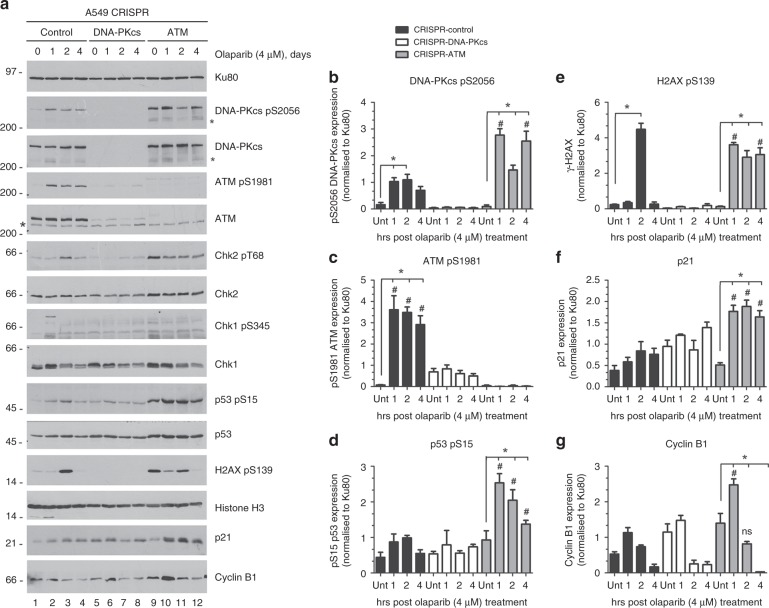
Fig. 3.
Olaparib induces a DNA damage response in ATM-deficient cells. a A549-CRISPR-control, A549-CRISPR-DNA-PKcs and A549-CRISPR-ATM cells were treated with olaparib (4 µM) for 1, 2 or 4 days, following which NETN extracts were generated and samples were run on SDS-PAGE as in Fig. 2a. Blots were probed for Ku80 as a loading control. Samples in lanes marked 0, were treated with DMSO for 4 days. Positions of molecular weight markers in kDa are shown on the left-hand side. The asterisks indicate non-specific bands. Panels b–g show quantitation of results from three separate experiments. Black bars represent control cells, white bars indicate A549-CRISPR-DNA-PKcs cells and grey bars represent A549-CRISPR-ATM cells. Western blots from two additional experiments, as well as quantitation of Chk2 T68 phosphorylation, is shown in Supplementary Fig. 6. Error bars represent mean with SEM of three independent experiments. One-way ANOVA was used to determine the statistical significance of three separate experiments. * Indicates p-value < 0.05 when compared to its own control group. # Indicates statistical significance when compared to the corresponding treatment groups of CRISPR-control cells

