Fig. 5.

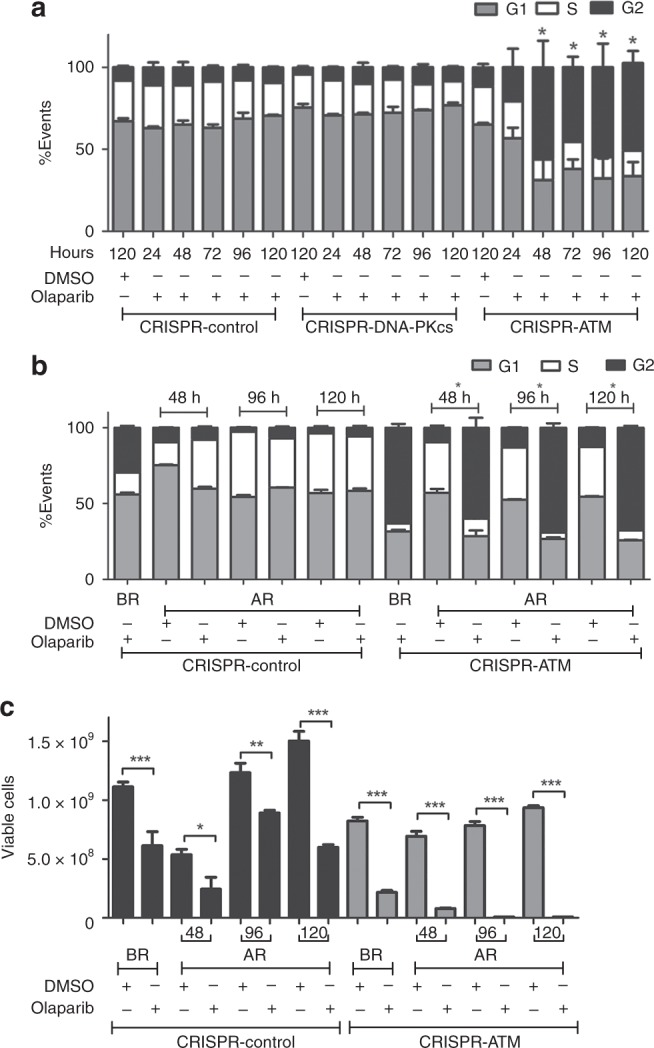
Olaparib induces reversible G2 arrest in ATM-depleted A549 cells. a A549-CRISPR-control, A549-CRISPR-DNA-PKcs and A549-CRISPR-ATM cells were treated with DMSO (120 h) or 4 µM olaparib and harvested after 24, 48, 72, 96 or 120 h as indicated then analysed by flow cytometry with propidium iodide staining. G1 cells are represented by grey bars, S phase cells by white bars and G2 cells by black bars. The figure shows the mean with SEM from three separate experiments. Statistical significance was determined using one-way ANOVA. * Represents, p < 0.05 for olaparib-treated cells relative to DMSO-treated cells. In no experiment did the sub-G1 fraction exceed 1% of total cells, indicating lack of apoptosis (data not shown). b A549-control and A549-CRISPR-ATM cells were treated with 4 µM olaparib for 120 h then released into fresh media containing either DMSO or 4 µM olaparib and harvested after an additional 48, 96 or 120 h, as indicated. Cells were analysed by flow cytometry with propidium iodide staining as above. The percentage of cells in G1, S and G2 are indicated in the grey, white and dark bars, respectively, as in panel (a). BR indicates before release and AR, after release. The figure represents the mean with SEM of three separate experiments. Statistical significance was determined using one-way ANOVA. * Represents, p < 0.05 for olaparib-treated cells relative to DMSO-treated cells. c Cells were treated with olaparib for 120 h then released either into fresh media containing either DMSO or olaparib as indicated then analysed by trypan blue exclusion assay to determine the number of viable cells. Black bars represent A549-CRISPR-control cells and grey bars A549-CRISPR-ATM cells. The figure represents the mean with SEM of three separate experiments. Statistical significance was determined using one-way ANOVA. The * represents, p < 0.05 for olaparib-treated cells relative to DMSO-treated cells as above
