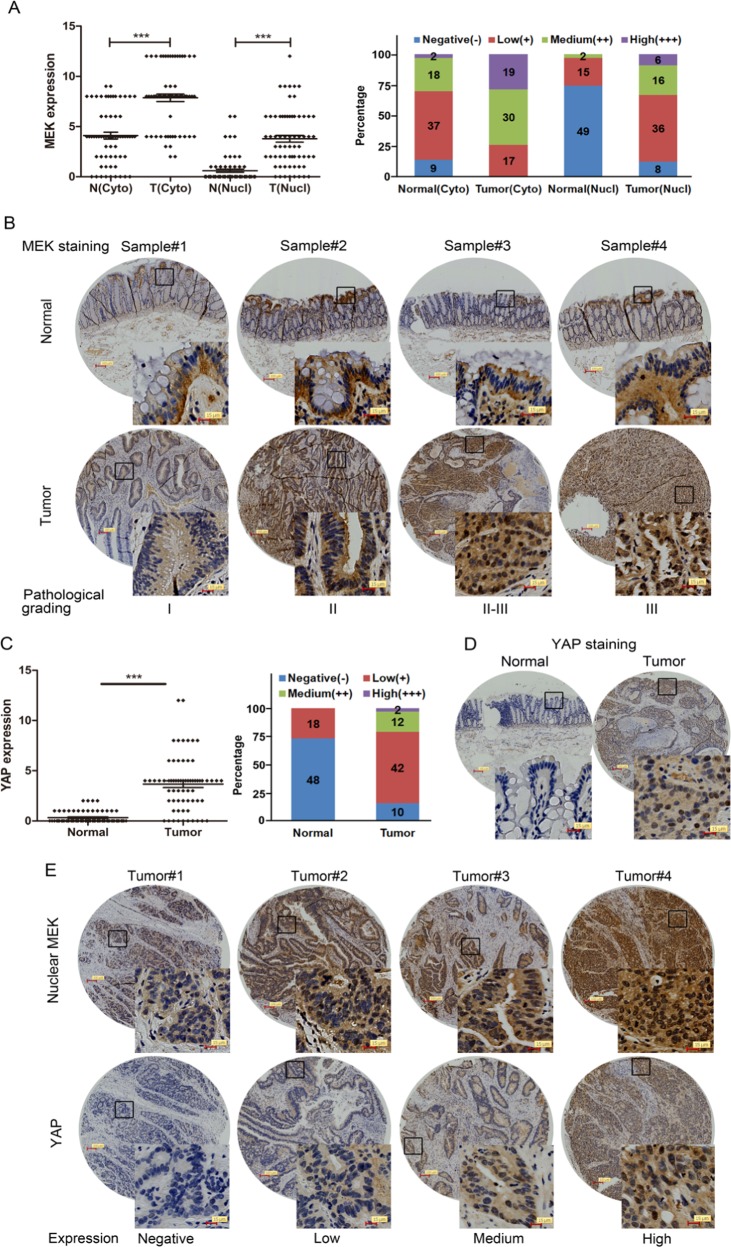
Fig. 6.
Aberrant nuclear localization of MEK and high expression of YAP in colon cancers. a TMA analysis of cytoplasmic and nuclear MEK expression in clinical samples of normal and colonl cancer tissues. IHC scores were showed in the left graph. The method assigning IHC scores for each sample was described in ‘Materials and methods' section. The bar graph (right) indicates the percentage of samples, ***p < 0.001. b Representative pictures of MEK staining in clinical samples of normal and colon cancer tissues with different pathological grading. Scale bar: 100/15 μm. c TMA analysis of YAP expression in normal and colon cancer tissues. IHC scores were showed in the left graph. The method assigning IHC scores for each sample was described in ‘Materials and methods' section. The bar graph (right) indicates the percentage of samples, ***p < 0.001. d Representative pictures of normal and colon cancer tissues stained for YAP. Scale bar: 100/15 μm. e Representative pictures of MEK and YAP staining in colon cancer tissues with different expression of nuclear MEK and YAP. Scale bar: 100/15 μm

