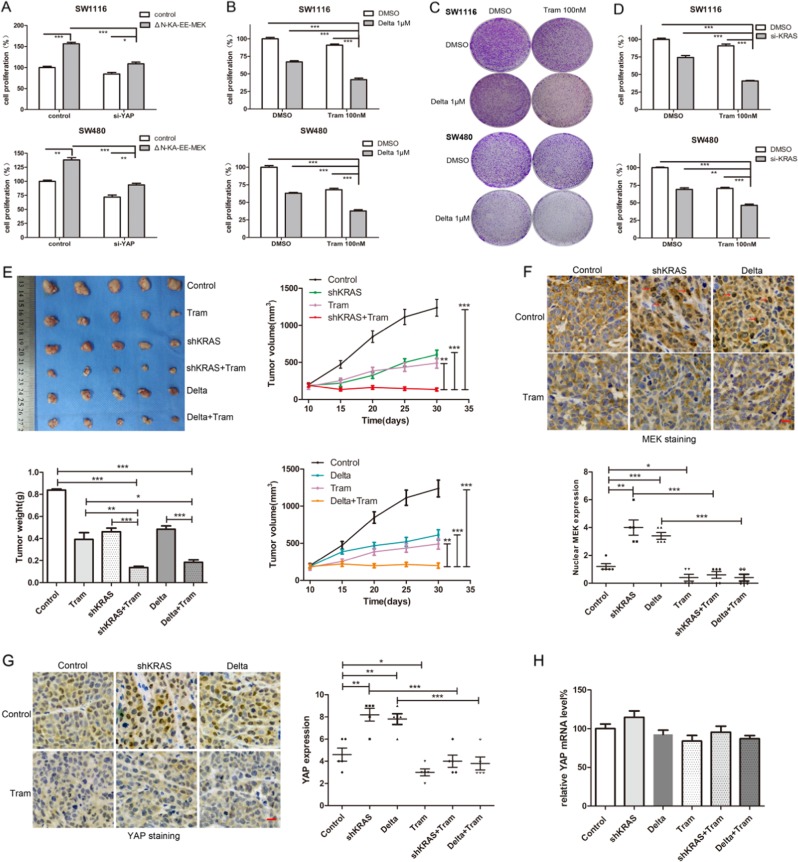
Fig. 7.
Targeting of KRAS synergizes with trametinib in suppressing the viability of KRAS mutant colon cancer cells in vitro and in vivo. a Cell proliferation assays using the Cell Counting Kit-8 in SW1116 and SW480 cells transfected with ΔN-KA-EE-MEK or control vector, in the presence or absence of YAP silencing at day 3. b Cell proliferation assays at day 3 of SW1116 and SW480 cells cultured with deltarasin (1M) or DMSO in the presence or absence of 100 nM trametinib. The data presented as the mean ± SD, *p < 0.05, **p < 0.01, ***p < 0.001 using Student’s t test (two-tailed). c Clonogenic assays of SW480 and SW1116 cells cultured with DMSO or 1 µM deltarasin (or/and 100 nM trametinib) at day 7. d Cell proliferation assays in SW1116 and SW480 cells transfected with siKRAS or negative control, and then cultured with 100 nM trametinib or DMSO for 3 days. The data presented as the mean ± SD, *p < 0.05, **p < 0.01, ***p < 0.001 using Student’s t test (two-tailed). e Tumour formation assays in the nude mice subcutaneously injected with SW480Teto-shKRAS (group shKRAS and shKRAS + tram) and SW480Teto-shControl. The mice were treated with DMSO (group Control and shKRAS), deltarasin (15 mg/kg), trametinib (3 mg/kg) in the vehicle (20% PEG300, 5% Tween 80 and normal saline) according to groups via intraperitoneal injection daily. All groups were fed with doxycycline water (2 g/L). The bar graph indicates the tumour weight of each group (n = 5). The tumour sizes were measured every 5 days. The line charts show the tumour volume of each group (n = 5). The data presented as the mean ± SD, *p < 0.05, **p < 0.01, ***p < 0.001 using Student’s t test (two-tailed). f Representative pictures of MEK staining in xenograft tumour tissues. The graph indicates the IHC scores of nuclear MEK expression, *p < 0.05, **p < 0.01, ***p < 0.001 using Student’s t test (two-tailed). g Representative pictures of YAP staining in xenograft tumour tissues. The graph indicates the IHC scores of nuclear YAP expression, *p < 0.05, **p < 0.01, ***p < 0.001 using Student’s t test (two-tailed). h Quantitative real-time RT–PCR to measure YAP mRNA level in xenograft tumour tissues. GAPDH was used as a control, ***p < 0.001 using Student’s t test (two-tailed)

