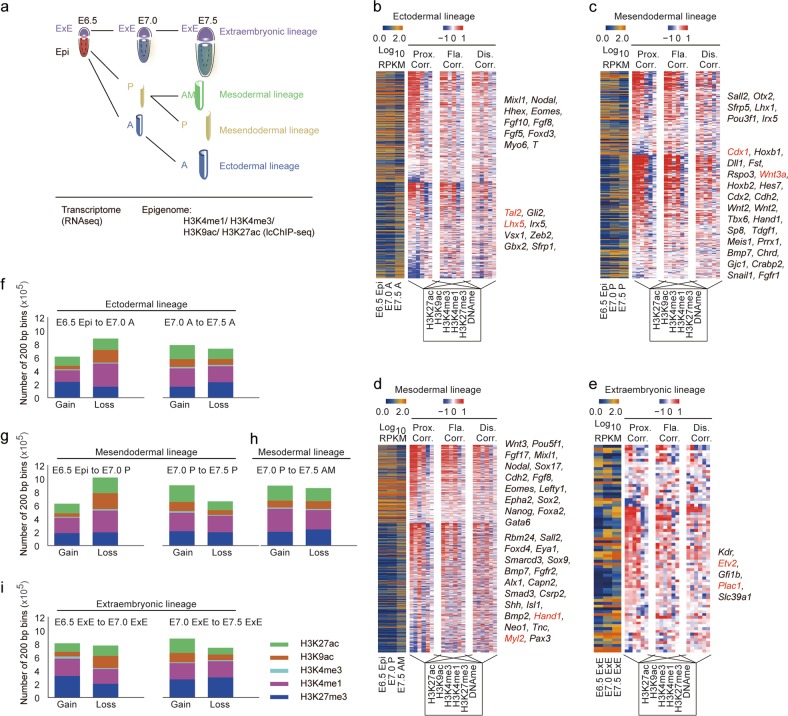
Fig. 1.
Epigenomic profiling of the mouse gastrula. a An illustrative scheme describing the sample collection strategy for the study of mouse gastrula. b‒e Heatmap indicating gene expression dynamics (down-regulation (top), up-regulation (bottom)), the corresponding correlation with each epigenetic modification in proximal (Prox, TSS ± 2 kb), flanking (Fla, TSS ± 2–10 kb), and distal regions (Dis, TSS ± 10–100 kb) during the development of ectodermal (b), mesendodermal (c), mesodermal (d) and extraembryonic (e) lineages. Representative genes are listed on the right of each map. f‒i Bar plot showing the number of 200-bp bins defined by ChromHMM with gain or loss of selected modification during the developmental process of the ectodermal (f), mesendodermal (g), mesodermal (h) and extraembryonic (i) lineages. H3K27me3 ChIP-seq and DNA methylation data for the mouse gastrula are from our previous report (GSE104243)

