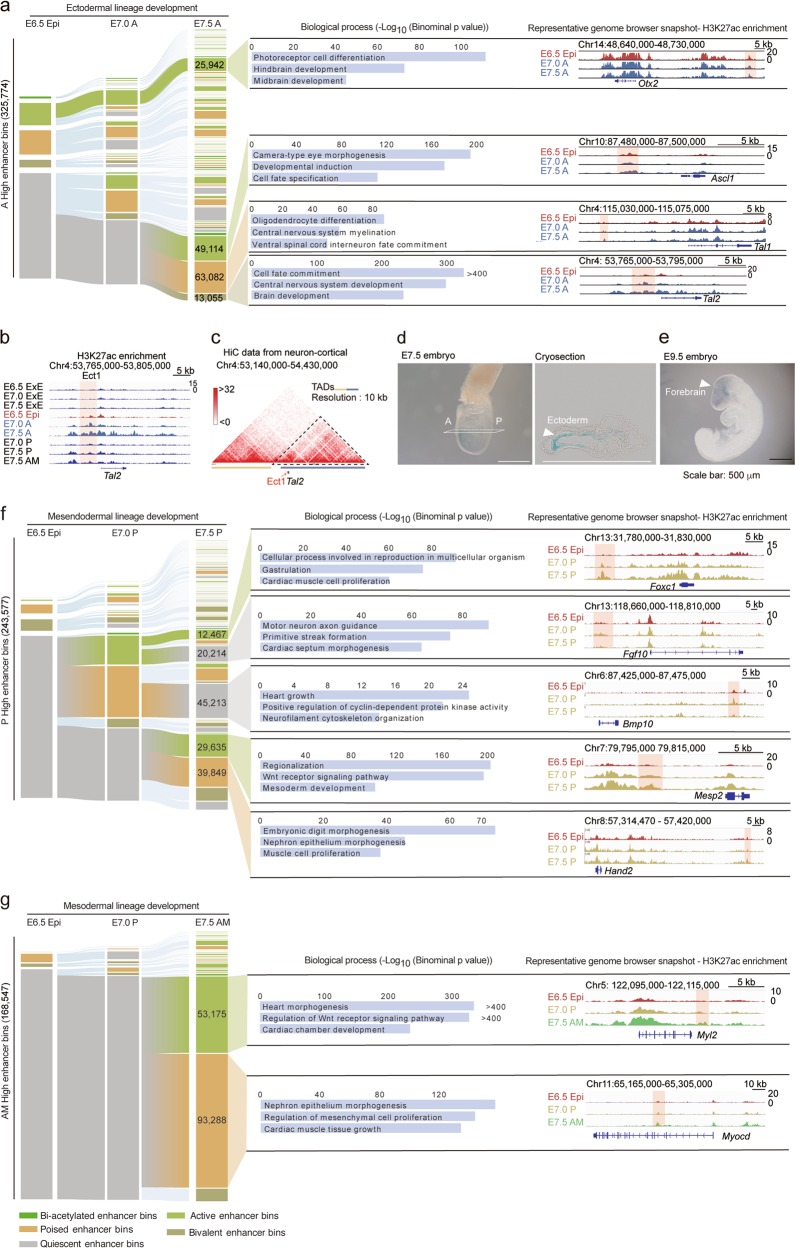
Fig. 4.
Lineage-specific dynamics of enhancers drives embryonic patterning during gastrulation. a Alluvial plot depicting the global activity dynamics of enhancer bins during the development of ectodermal lineage. Each line represents a 200-bp bin defined based on the ChromHMM categories. Numbers of representative state enhancer bins are shown. The representative biological process terms identified using GREAT analysis are listed. Bar plots indicate the significance of corresponding terms. The representative genome browser snapshots are also shown. b, c Representative genome browser snapshots of H3K27ac in all samples (b) and chromatin interaction frequency heatmap at 10 kb resolution in mouse cortical neurons (c) at the range of Tal2 locus. The Tal2-related enhancer Ect1 (highlighted with a red rectangle, b) is located in the topologically associating domain (TAD). Chromatin conformation capture HiC data are from a published dataset (c).39 d, e Ect1 enhancer activity reporter expression (blue staining) in representative transgenic mouse gastrula (E7.5 stage, d) and organogenic embryo (E9.5 stage, e). A cryosection slide of the stained E7.5 embryo is also shown (d). All experiments were performed at least twice. f, g Alluvial plots depicting the global activity dynamics of enhancer bins during the development of mesendodermal (f) and mesodermal (g) lineages. Each line represents a 200-bp bin defined based on the ChromHMM categories. Numbers of representative state enhancer bins are shown. The representative biological process terms identified by GREAT analysis are listed. Bar plots indicate the significance of corresponding terms. The genome browser snapshots of representative genes are also shown

