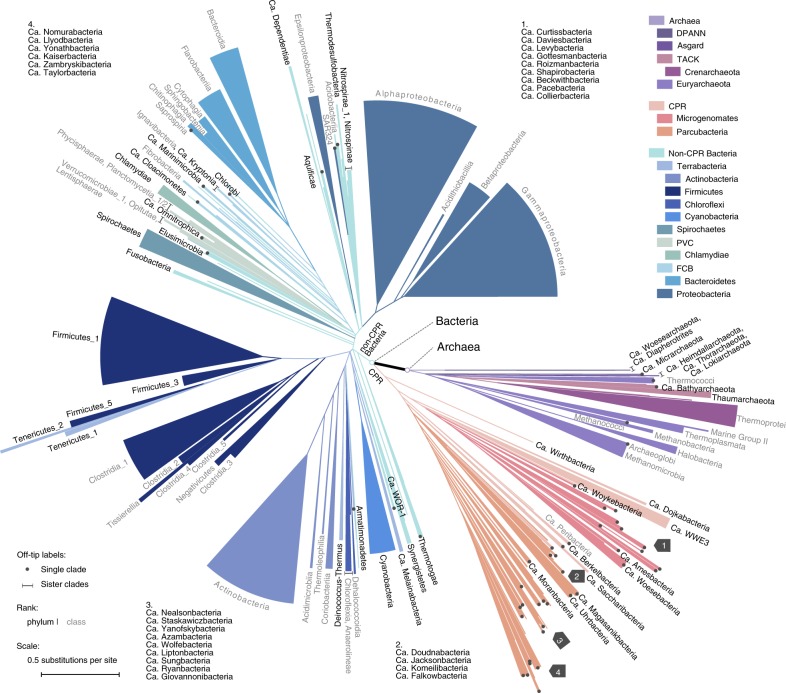
Fig. 1.
A new view of the bacterial and archaeal tree of life. The tree contains 10,575 evenly distributed bacterial and archaeal genomes, with topology reconstructed using ASTRAL based on individual trees of 381 globally sampled marker genes, and branch lengths estimated based on 100 most conserved sites per gene. Branches with effective number of genes (en) ≤ 5 and local posterior probability (lpp) ≤ 0.5 were collapsed into polytomies. Taxonomic labels at internal nodes and tips reflect the tax2tree curation result. Color codes were assigned to above-phylum groups and phyla with 100 or more representatives. To display the tree in a page, it was collapsed to clades (sectors) representing phyla with at least one taxon (black), and classes with at least ten taxa (gray). The radius of a sector indicates the median distance to all descending taxa of the clade, and the angle is proportional to the number of descendants. For polyphyletic taxonomic groups, minor clades with <5% descendants of that of the most specious clade were omitted, while the remaining clades were appended a numeric suffix sorted by the number of descendants from high to low. Dots (single clade) and lines (sister clades) are used to assist visual connection between tips and labels, where necessary. In four instances where visual space is inadequate (marked by gray arrows), groups of labels in clockwise order are provided in remote blank areas. Source data are provided as a Source Data file.

