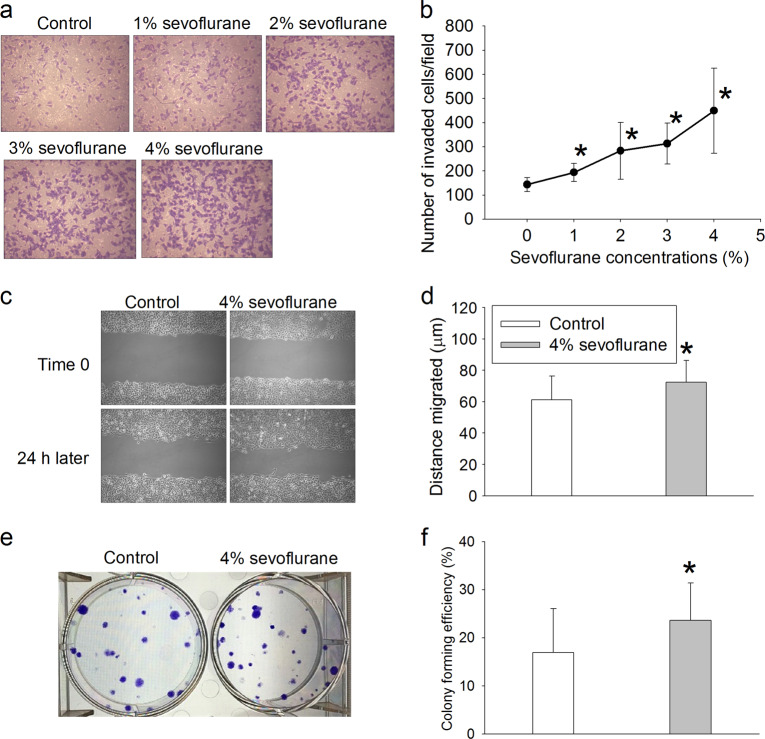
Fig. 2.
Sevoflurane-induced increase in invasion, migration, and colony-formation in U251 cells. U251 cells were exposed to various concentrations of sevoflurane for 4 h. Cells were used for experiments 24 h later. a Representative images of invaded cells, b quantitative results of cell invasion assay, c representative images of migration assay, d quantitative results of migration assay, e representative images of cell colonies, f quantitative results of colony-formation assay. The results are shown as the mean ± S.D. (n = 6 for b, n = 17 for d and n = 14 for f). *P < 0.05 compared with control

