Figure 4.
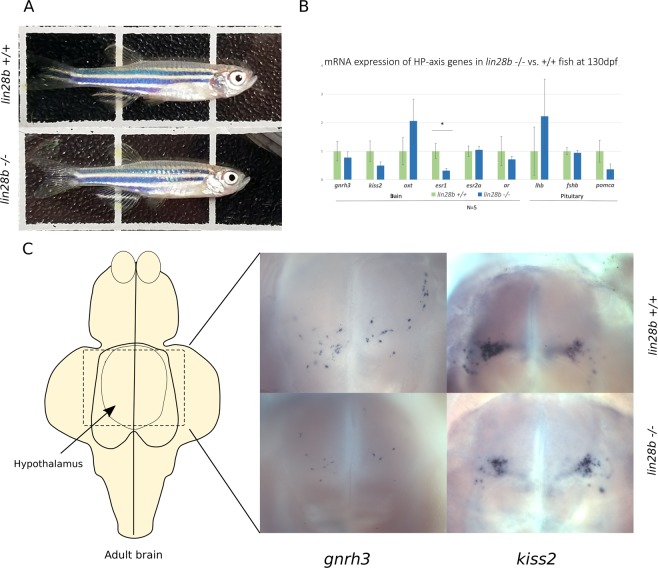
Inspection of the HP axis of the lin28b KO fish after sexual maturation. (A) Images of 130 day old fish (lin28b KO =−/−, lower panel). The KO fish behaved normally and showed no obvious phenotypic differences compared to controls at this stage. (B) qPCR results from 130d old fish evaluating gene expression at the HP axis. The results suggest that esr1 expression is downregulated in the KO brain compared to controls, although for example gnrh3 expression was not significantly different between the groups in the analysis. N = 5 per group, One-Way-ANOVA with post-hoc Tukey HSD, Error bars = SEM, *P < 0.05. Size of the fish used in the qPCR experiment is shown in the Supplementary Table 2. (C) Left: Schematic diagram of adult zebrafish brain (ventral view) with the hypothalamic region in the middle (arrow). Right: visualization of gnrh3 and kiss2 expression in the hypothalami of 210d old lin28b KO (−/−) and control (+/+) fish by in situ hybridization. The localization of gnrh3/kiss2 expression appeared roughly similar, although the number of stained neurons varied between individual samples within each group (2–4 samples per group). The variation appeared potentially related to the size differences of the fish (for samples shown: gnrh3, +/+ size = 32 mm/300 mg; −/−, 27 mm/200 mg; kiss2+/+30 mm/230 mg, −/− 29 mm/190 mg).

