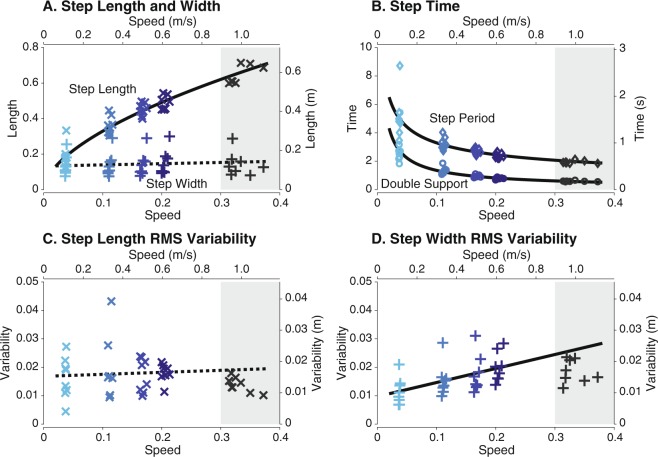
Figure 1.
Mean step parameters over a range of speeds. As speed decreased, (A) step length decreased with no significant changes in step width, (B) step period and double support period increased, (C) no significant change was found for step length variability, and (D) step width variability decreased. Variability is defined as root-mean-square (RMS) deviations from mean steps. Trend significance indicated by solid lines () and non-significance by dashed lines. Data at self-selected speeds not included in fit (shaded region). Vertical axes are shown in both dimensionless (left axes) and SI form (right axes); speed in horizontal axes are also shown in both dimensionless (lower axes) and SI form (upper axes).

