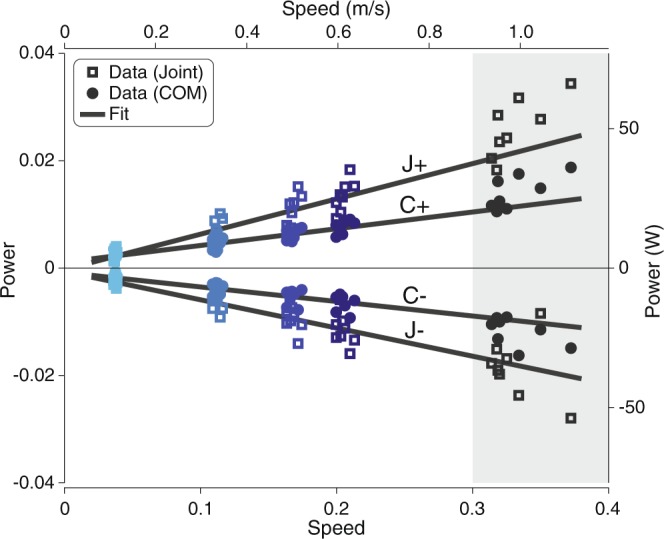
Figure 5.

Mean mechanical work rates across walking speeds. Mean COM work rate per stride (C+, ) and mean summed joint work rate per stride (J+, ) decreased linearly with speed, with a steeper rate of decrease for the summed joint work rates. Different colors denote subjects’ data at each walking speed (squares for joint work rates, circles for COM work rates). Trend significance is indicated by solid lines (). Data at self-selected speeds not included in fit (shaded region). Power is shown in both dimensionless (left axis) and SI form (right axis); speed is also shown in both dimensionless (lower axis) and SI form (upper axis).
