Fig. 1.
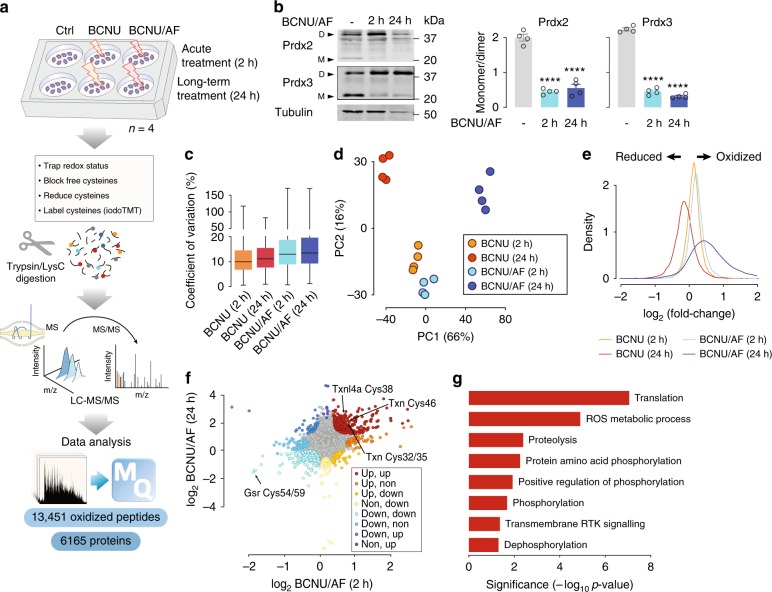
Redox proteomic analysis of adipocytes. a Experimental design of the redox proteomic analysis of adipocytes treated with BCNU or BCNU/AF. b Immunoblotting of Prdx2/3 dimerisation. Prdx2/3 dimer/monomer ratio was measured. Data were shown as mean ± SEM from n = 4, ****p < 0.0001 by one-way ANOVA. c Coefficient of variation of the quantified redox proteome. Boxes capture lower quartile and upper quartile with median displayed as a horizontal line in the middle; whiskers are min and max. d Principal component analysis of the redox proteome. e Relative intensities of the quantified redox proteome. f Direction-based integrative analysis of redox proteome between 2 h and 24 h treatment of BCNU/AF (see “Methods”). Significantly oxidized peptides were coloured (p < 0.01, by modified Pearson’s Correlation Test32). g Direction pathway analysis of significantly oxidized proteins under both the 2 h and 24 h treatment of BCNU/AF (corresponding to the red dots in Fig. 1f) using gene ontology.

