Fig. 2.
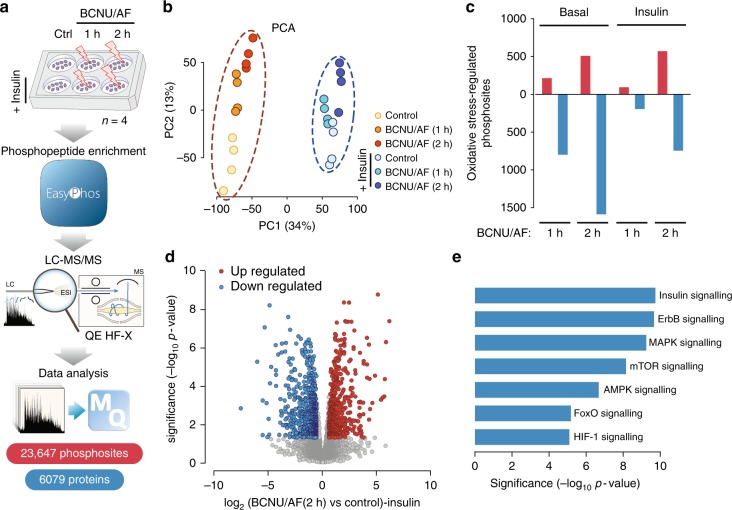
Oxidative stress-regulated phosphoproteome in adipocytes. a Experimental design of the phosphoproteomic analysis of insulin- and BCNU/AF-treated adipocytes. b Principal component analysis of the phosphoproteome. c Summary of oxidative stress-regulated phosphoproteome in adipocytes with or without insulin treatment. d Volcano plot showing oxidative stress-regulated phosphoproteome in adipocytes with 2 h BCNU/AF treatment in the presence of insulin. Significantly regulated phosphosites (by moderated t-test from limma R package) were indicated in red (up-regulated) or blue (down-regulated, adjusted p < 0.05 and absolute fold change > 1.5). e Gene ontology over-representation analysis (Fischer’s exact test) of significantly oxidative stress-regulated phosphoproteins with 2 h BCNU/AF treatment in the absence of insulin.

