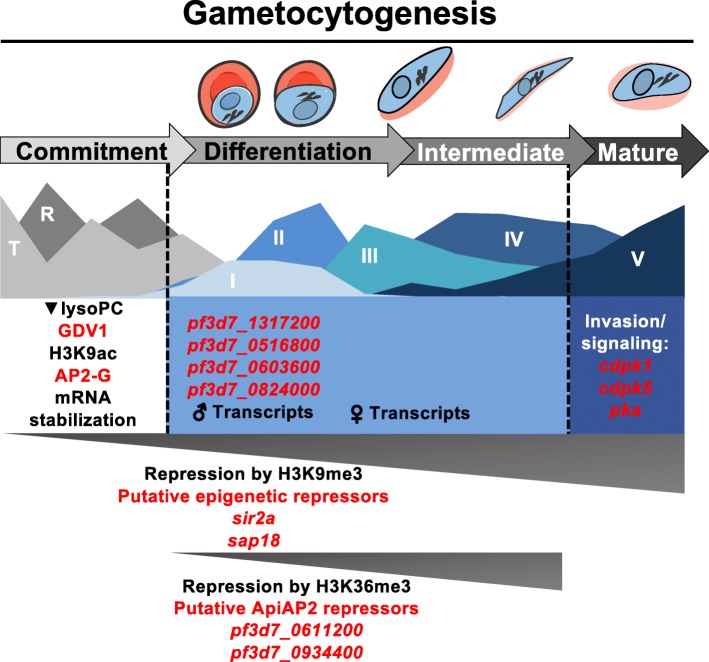
Fig. 6.
Molecular model of regulatory modules that shape cellular differentiation during gametocytogenesis. Specific regulatory events are mapped out over the extended gametocyte development of P. falciparum parasites. Molecular regulators are highlighted in red while specific events or epigenetic marks are shown in black. Colored blocks indicate the span of specific phases of transcript abundance, with dotted lines indicating transition points in gametocyte development and grey triangles indicate the timing of repressive mechanisms in gametocyte development. Parasite drawings were modified from freely available images (https://smart.servier.com/), under a Creative Commons Attribution 3.0 Unported Licence

