
Fig. 4.
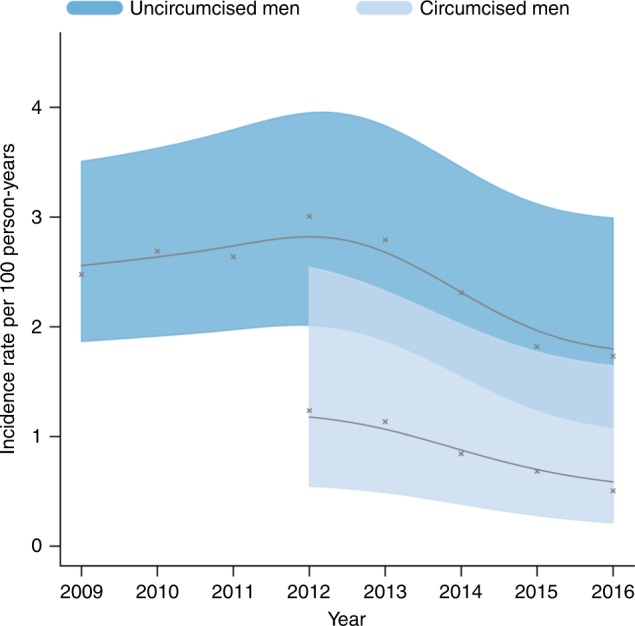
Age-adjusted HIV incidence rates for men who reported being uncircumcised (N = 5134) and circumcised (N = 2306). Due to a small number of recorded seroconversions between 2009 and 2011, the incidence rate for circumcised men is plotted from 2012 to 2016. The figure shows that uncircumcised men had a lower incidence of HIV infection, and that declines in HIV incidence occurred after 2012 for both uncircumcised and circumcised men.