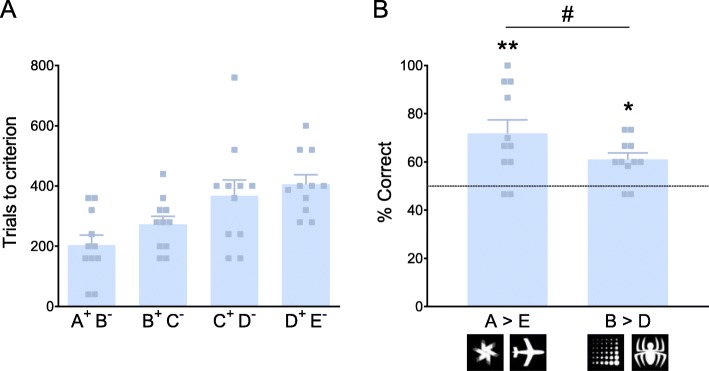
Fig. 1.
Validation of our refined visual transitive inference task. a Trials to criterion during learning the 4 premise stimulus pairs. b Performance accuracy (% correct responses) on transitive inference test session for A>E (non-transitive) and B>D (transitive). Correct performance above chance on A>E (t = 3.541, p = 0.005) and B>D (t = 3.016, p = 0.013). Accuracy on A>E greater than B>D (t = 1.91, p = 0.043). Data presented as means ± SEM. Dotted line indicates 50% accuracy (chance performance). # denotes significant difference from chance performance (#p < 0.05; ##p < 0.01); * denotes significant difference between stimulus pairs (*p < 0.05)

