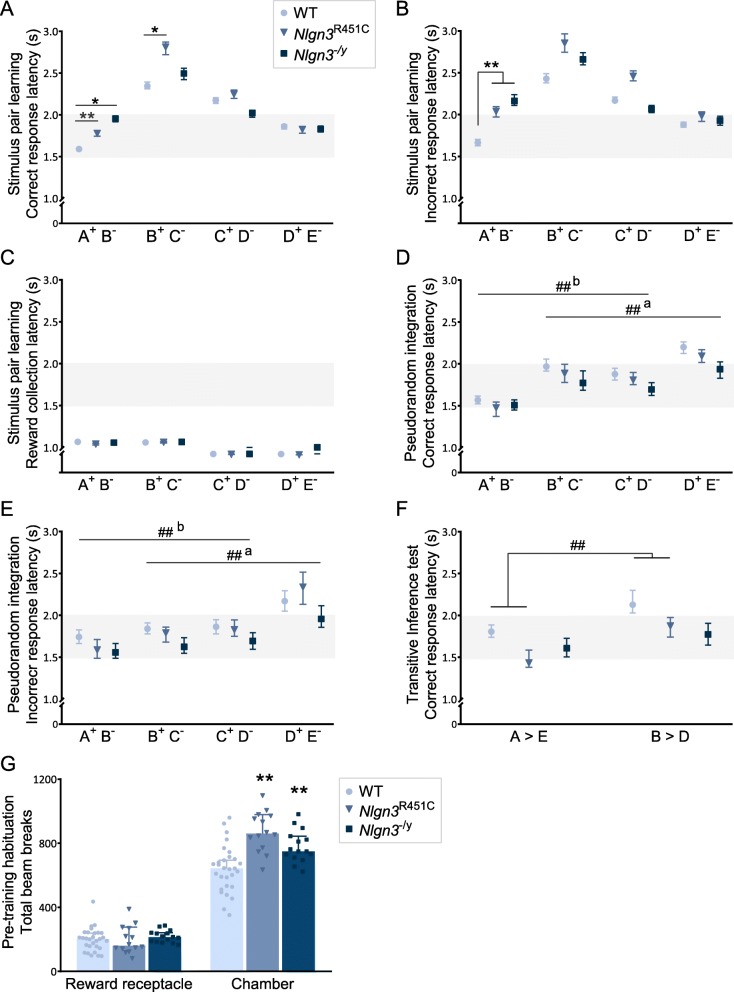
Fig. 5.
Response and reward collection latencies in Nlgn3R451C and Nlgn3−/y mice.
a Correct and b incorrect response latencies, and c reward collection latencies discrimination learning for the 4 premise stimulus pairs (stage 2). a–b See Additional file 1: Table S8 for statistics. d Correct and e incorrect response latencies during pseudorandom integration (stage 4, last 5 sessions). See Additional file 1: Table S9 for statistics. F Correct response latencies for A>E (non-transitive) and B>D (transitive) during transitive inference test session (WT: p = 0.002, aMD = 0.324, 95% CI = 0.120, 0.528; Nlgn3R451C: p < 0.001, aMD = 0.441, 95% CI = 0.253, 0.629; Nlgn3−/y: p = 0.065, aMD = 0.165, 95% CI = − 0.010, 0.340). a–f Data presented as median ± 95% CI. g Total infrared beam breaks in the reward receptacle and chamber (front and back beams) during habituation to the touchscreen chambers in pre-training. One-way ANOVA F(2, 60) = 16.17, p < 0.01; post hoc Bonferroni correction for multiple comparisons; WT to Nlgn3R451C p < 0.001, WT to Nlgn3−/y p = 0.006). Data presented as mean ± SEM. * denotes significant differences between genotypes (*p < 0.05; ** p < 0.01); # denotes significant differences between pairs (##p < 0.01, #p < 0.05); a = difference from pair A+B−, b = difference from pair D+E−. Horizontal grey bands added to aid visual comparison

