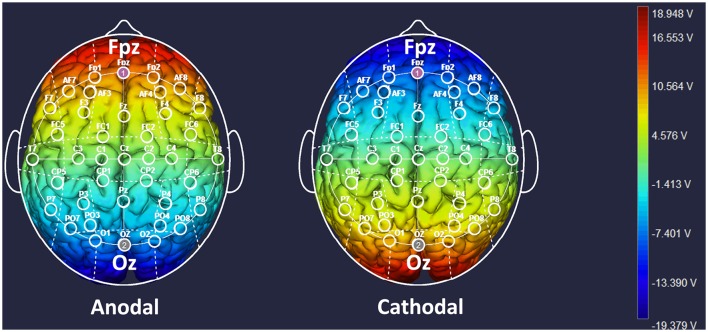
Figure 1.
Locations of the electrodes and stimulation modes in transcranial direct current stimulation (tDCS) treatments. Schematic of electrode positions Fpz and Oz based on the international electroencephalography (EEG) 10–20 system of the human brain. The shading represents the range of input voltage from −19.379 V to 18.948 V.

