Figure 2.

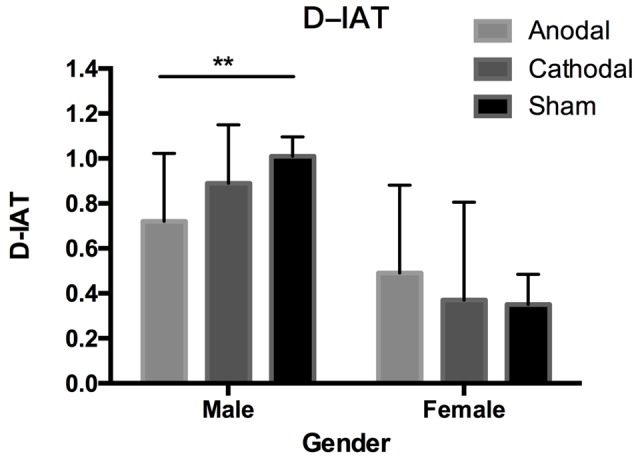
Data of D-implicit association test (IAT) scores. Error bars indicate 95% confidence intervals. Asterisks indicate significant differences in gender stereotypes between treatments.

Data of D-implicit association test (IAT) scores. Error bars indicate 95% confidence intervals. Asterisks indicate significant differences in gender stereotypes between treatments.