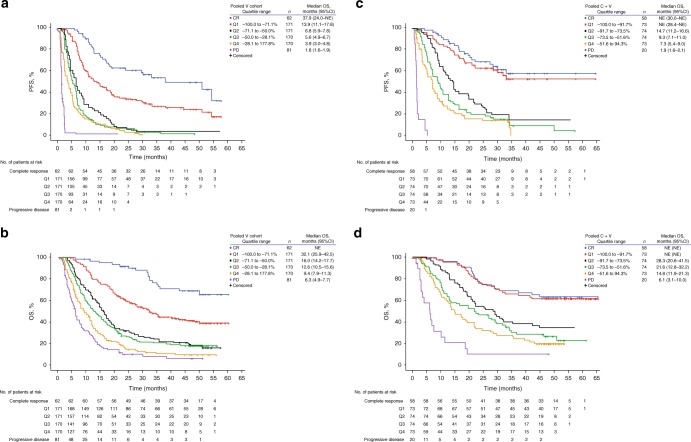
Fig. 2.
Kaplan–Meier analysis of (a) PFS and (b) OS by tumour reduction quartiles, and in patients with complete response or disease progression, in the vemurafenib monotherapy cohort, and of (c) PFS and (d) OS in the cobimetinib plus vemurafenib cohort. CI confidence interval, CR complete response, C + V cobimetinib plus vemurafenib, NE not estimable, OS overall survival, PD progression of disease, PFS progression-free survival, Q quartile, V vemurafenib

