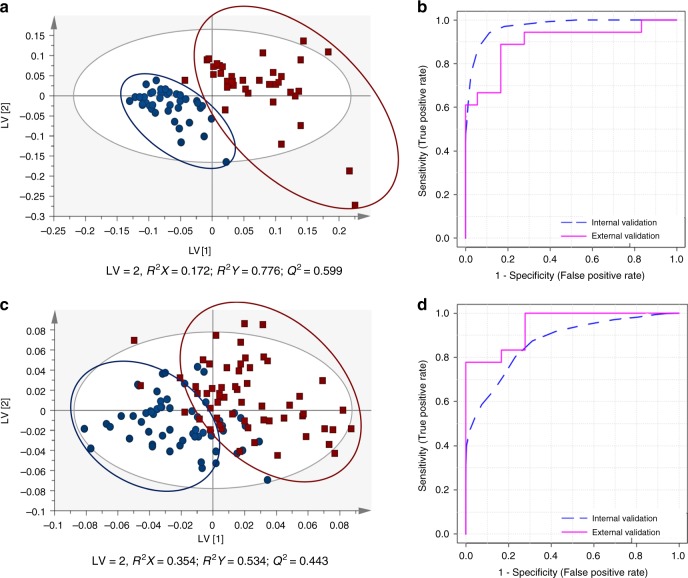
Fig. 1.
a PLS-DA scores scatter plot (Pareto scaling; 2 components) obtained for VOCs training model of PCa patients (n = 40, squares) vs. cancer-free controls (n = 42, circles), after variable selection; b Assessment of the diagnostic performance of the PLS-DA model obtained for VOCs using the training set (AUC = 0.975; sensitivity = 92%; specificity = 100%) and the external set (AUC = 0.898; sensitivity = 78%; specificity = 94%) through ROC analysis; c PLS-DA scores scatter plot (Pareto scaling; 2 components) obtained for VCCs training model of PCa patients (n = 40, squares) vs. cancer-free controls (n = 40, circles), after variable selection; d Assessment of the diagnostic performance of the PLS-DA model obtained for VCCs using the training set (AUC = 0.878; sensitivity = 71%; specificity = 97%) and the external set (AUC = 0.944; sensitivity = 78%; specificity = 100%) through ROC analysis

