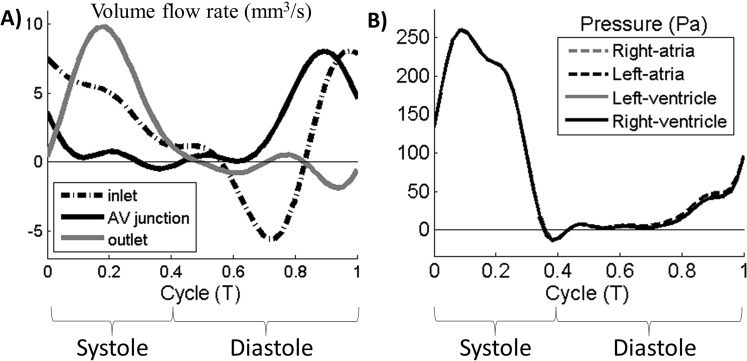
Figure 4.
(A) Volume flow waveform in the embryonic heart at the atrial inlet, the ventricular outlet and the atrioventricular (AV) junction. (B) Pressure waveform in the different cardiac structures. Pressure waveform value was taken from literature and applied at the ventricle outlet15. Pressure difference from flow simulations was then used to compute pressures in other parts of the heart. Systole and diastole in this figure refered to ventricle systole and ventricle diastole respectively.

