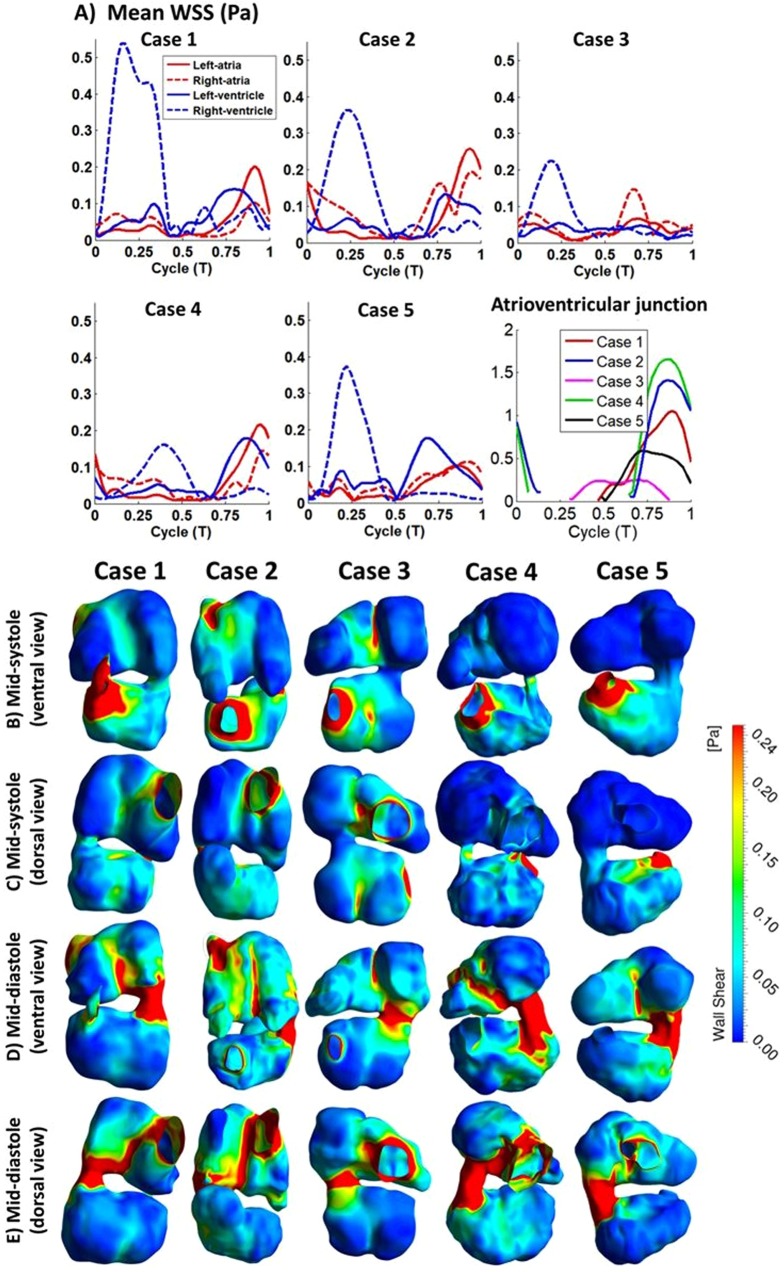
Figure 7.
(A) Averaged WSS magnitude of different heart structures across a cardiac cycle and at atrioventricular junction for 5 embryos. (B–E) Surface WSS plot of embryonic heart. Higher WSS were noticed at region with narrow area such as the inlet, atrioventricular junction, outlet, middle region of atria, and mid region of ventricle. (B,C) Ventricle mid-systole, maximum flow at ventricle outlet. (D,E) Ventricle mid-diastole, maximum flow at ventricle inlet (C,E) dorsal view. (B,D) ventral view.

