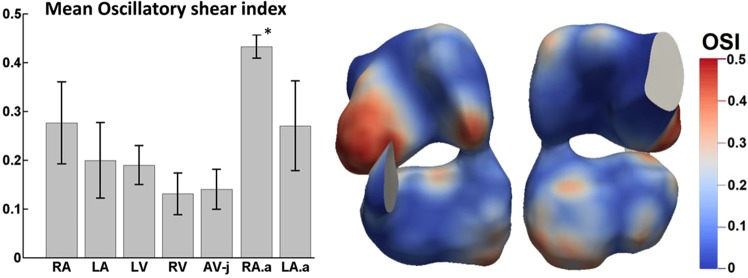
Figure 8.
(left) Oscillatory shear index (OSI) of various cardiac zones (n = 5). The right atria appendage exhibited significantly higher OSI than other region (*P < 0.006 compared to all other cardiac zones). (right) Spatial variability of OSI. RA, LA - Right Atria and Left Atria inclusive of their appendages, LV-Left ventricle, RV-Right Ventricle, AV-j-Atrioventricular junction, RA.a-Right atria appendage, LA.a-Left atria appendage.

