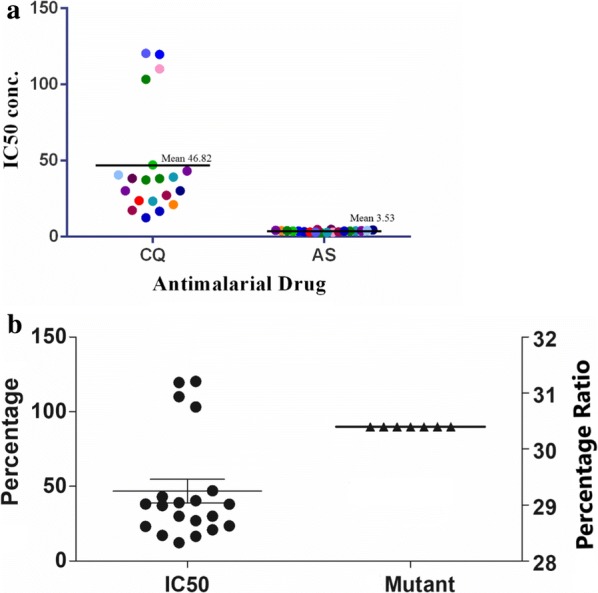
Fig. 4.

a The IC50 pattern of the field isolates (represented by coloured dots) tested for chloroquine (CQ) and artesunate (AS) drug. b Graph showing the comparative analysis of inhibitory concentration (IC50) of adapted isolates with K76T (Pfcrt) mutant isolates after sequencing analysis (X-axis). The percentage values of field isolates for both analysis shows the accordance of results in them
