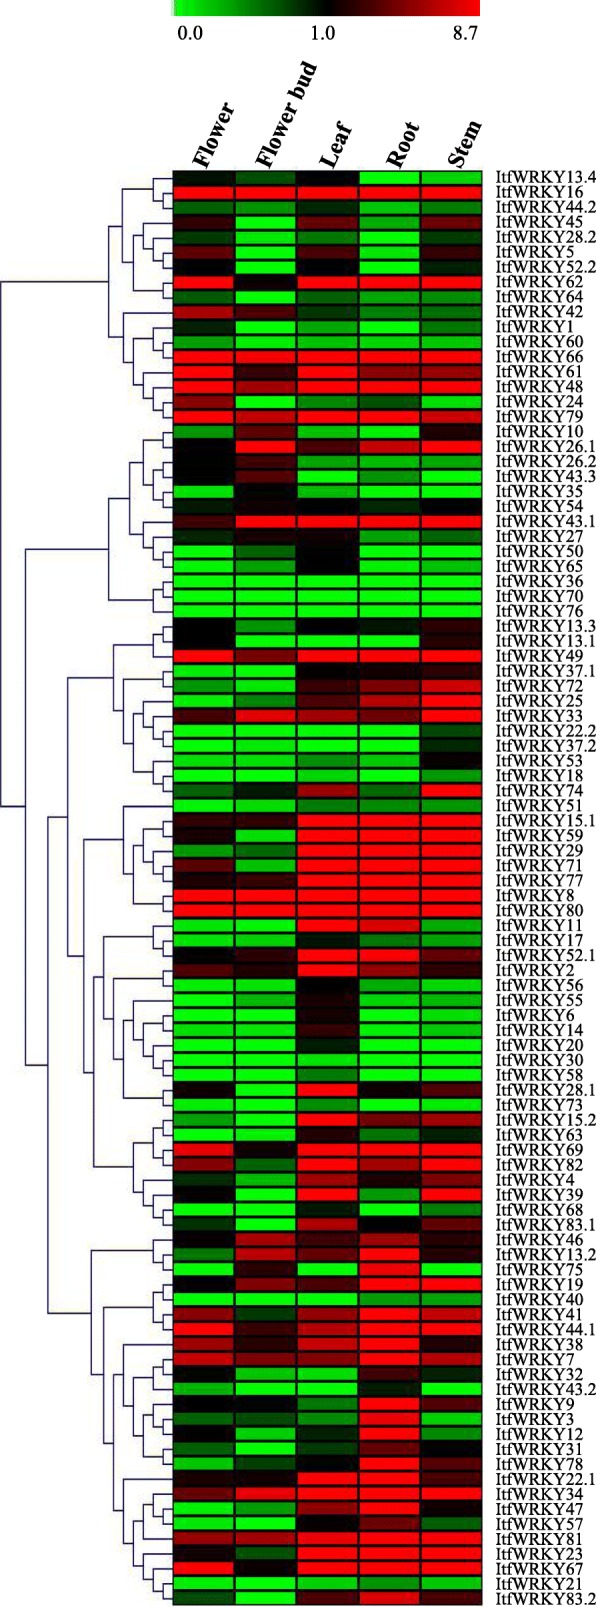
Fig. 5.

Relative expression levels of ItfWRKYs across various tissues. A heat map with clustering is created based on the FPKM value of ItfWRKYs. The coloured scale varies from green to red, indicating relatively low or high expression

Relative expression levels of ItfWRKYs across various tissues. A heat map with clustering is created based on the FPKM value of ItfWRKYs. The coloured scale varies from green to red, indicating relatively low or high expression