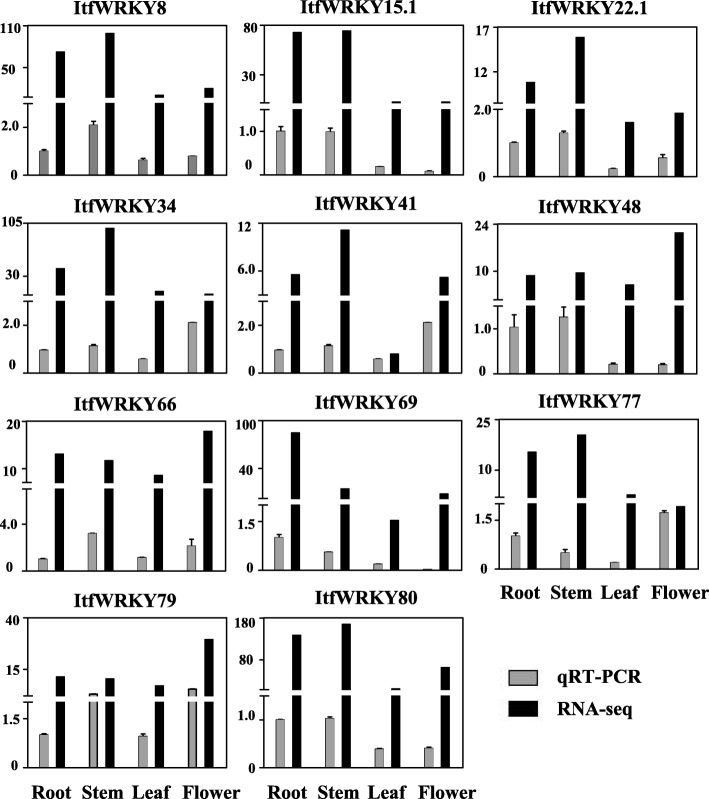
Fig. 6.
Comparison between quantitative RT-PCR data and RNA-seq data. Relative expression of the 11 selected ItfWRKYs was analysed by qRT-PCR. The GAPDH transcript levels were used for normalisation. The y-axis represents the relative expression of the fold. Error bars indicate standard deviation. RNA-seq and qRT-PCR data are represented by black and grey bars, respectively

