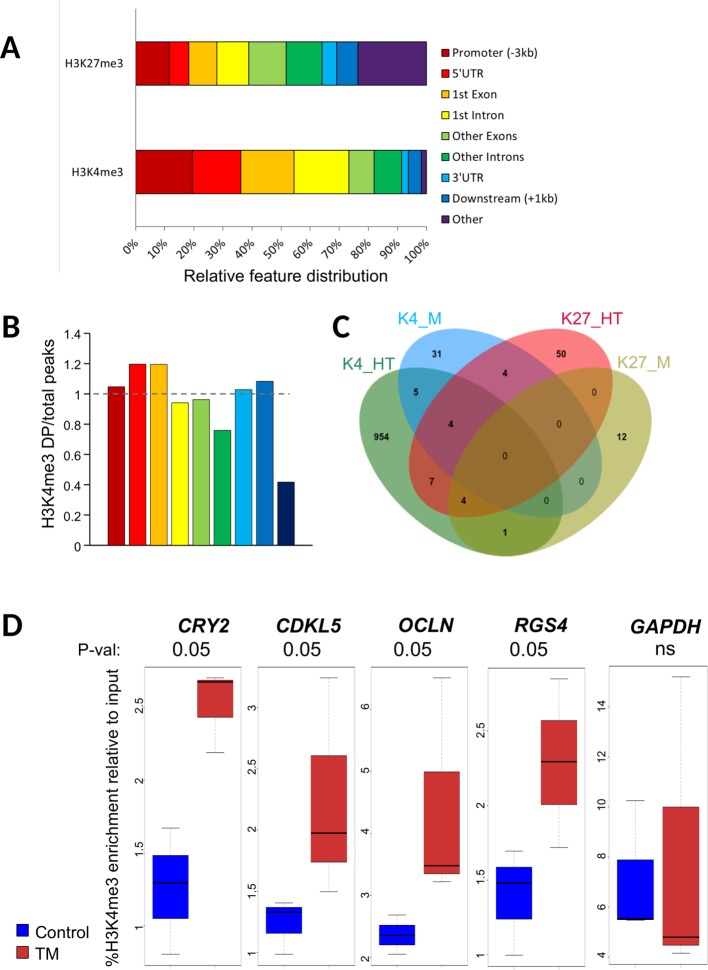
Figure 1.
Characteristics of differential peaks. (A) Percentage of ChIP-seq H3K4me3 differential peaks across genomic features in hypothalamus relative to all differential peaks, obtained using GenomeFeatures. Promoter and downstream regions were defined upstream of Transcription Start and End Sites (TSS and TES, respectively), respectively. (B) Barplot showing the ratio for each feature between the percentage of differential peaks (DP) per feature relative to all DP and the percentage of all peaks per feature vs. all peaks for H3K4me3 in hypothalamus. The color legend is the same as in Figure 1A . (C) Venn diagram showing the number of genes containing a DP that are specific or common for H3K4me3 (K4) and H3K27me3 (K27) marks in hypothalamus (HT) and muscle (M) tissues. (D) Box plot of H3K4me3 relative enrichment to input at CRY2, CDKL5, OCLN, and RGS4 loci in Control (blue) and TM (red) replicates. Box boundaries represent the first and third quartiles. The median is indicated by the bold horizontal line dividing the interquartile range. Upper and lower ticks indicate the 10th and 90th percentiles. Corresponding p-values are indicated at the top of each graph

