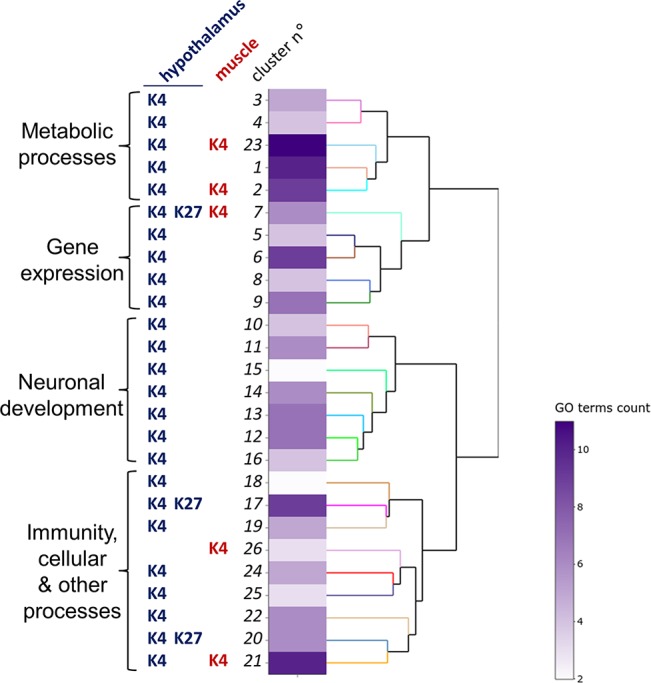
Figure 2.

Functional analysis of hypothalamus and muscle genes bearing H3K4me3 and H3K27me3 differential peaks.The clustering heatmap plot of functional sets of gene ontology (GO) terms was obtained using ViSEAGO. From left to right are shown the major processes, the conditions defining the clusters (histone marks, tissues) defining the clusters, the cluster number, a heat map with the number of GO terms in each set and a dendrogram based on BMA semantic similarity distance and Ward’s clustering criterion.
