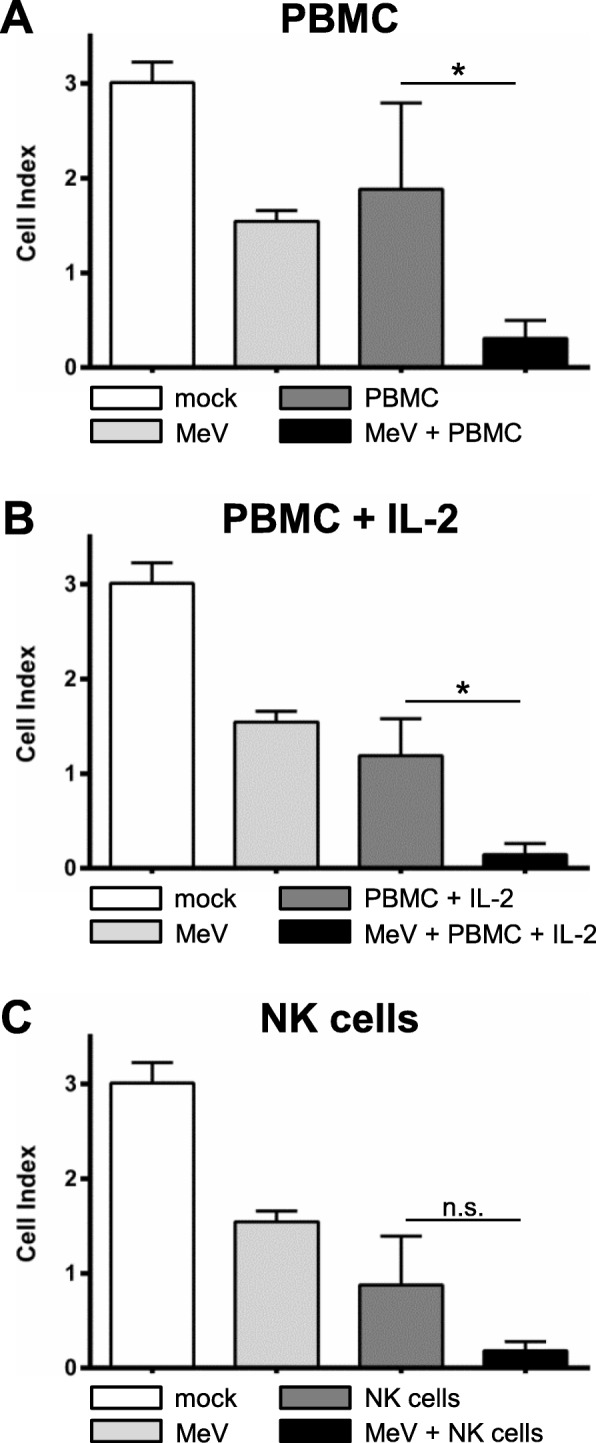
Fig. 6.

Statistical analysis of MeV-GFP-mediated oncolysis of A673 sarcoma cells after co-treatment with PBMC/NK cells isolated from a healthy donor. Analysis was performed as described in Fig. 5. Real-time cell proliferation is depicted as Cell Index after addition of PBMCs (a), PBMC stimulated with IL-2 (b), and NK cells (c) at 107 hpi. * p < 0.05; ** p < 0.01, *** p < 0.001, n.s. not significant
