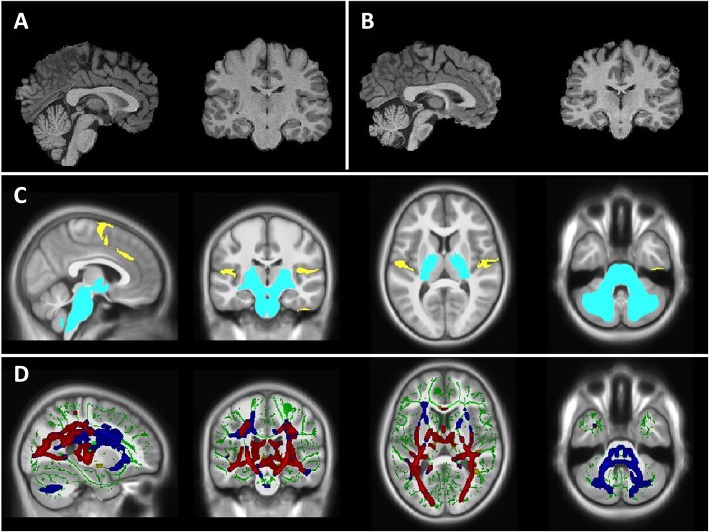
Fig. 3.
a) Sagittal and coronal view of a healthy young adult brain. b) Sagittal and coronal view of a young adult brain with Wolfram syndrome. c) Significant volumetric differences between Wolfram syndrome and controls, controlling for whole brain volume. Regions that are smaller in Wolfram syndrome are in light-blue, while regions that are larger are in yellow. d) White matter microstructure alterations in Wolfram syndrome as measured by diffusion tensor imaging. Green: white matter skeleton created by tract-based spatial statistics skeletonization step; Blue: white matter tracts with greater radial diffusivity in Wolfram syndrome; Yellow: lower fractional anisotropy; Red: white matter tracts with overlap of greater radial diffusivity and lower fractional anisotropy is shown in red

