Fig. 2.

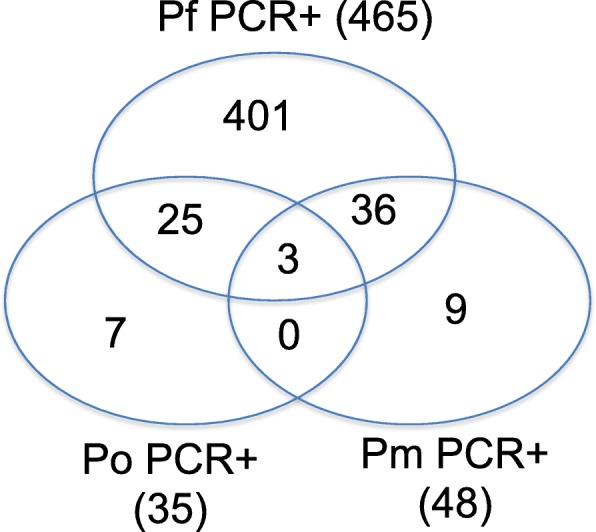
Prevalence of PCR detectable Plasmodium species within the study sites. A Venn diagram showing the frequency as counts of each of the Plasmodium species identified by PCR

Prevalence of PCR detectable Plasmodium species within the study sites. A Venn diagram showing the frequency as counts of each of the Plasmodium species identified by PCR