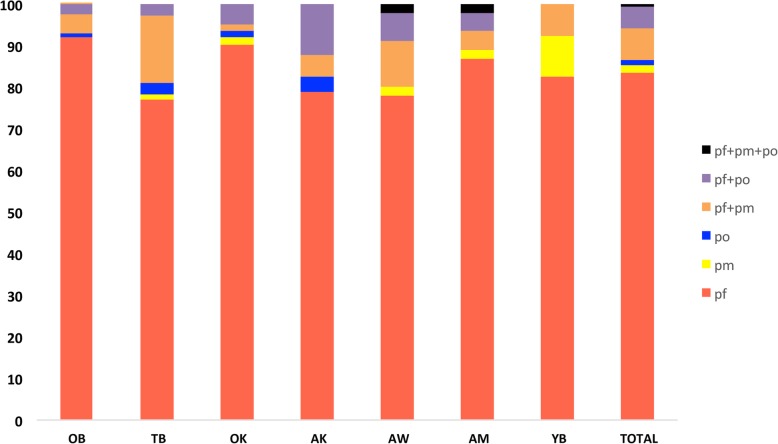
Fig. 4.
The distribution of PCR detectable Plasmodium species within the study sites. OB, Obosono; TB, Towoboase; OK, Okomfo; AK, Akwensu; AW, Awensu; AM, Amokope; YB, Yaw Boadi; mono species infection; pf: Plasmodium falciparum (red), pm: Plasmodium malariae (yellow), po: Plasmodium ovale (blue), multi species infection; pf + pm (orange); pf + po (purple); pf + pm + po (black). Prevalence is expressed as the % of total parasites identified in each site

