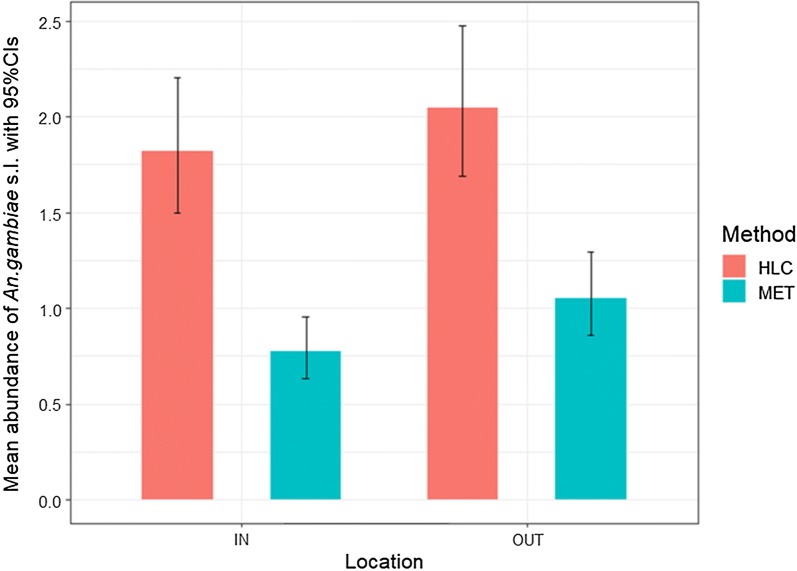
Fig. 4.
Mean predicted abundance of An. gambiae s.l. per night made at different trapping locations (IN = inside houses, OUT = peri-domestic area outside of houses) using two different trapping methods (pink bars = HLC; blue bars = MET) between October 2016 and December 2017. Errors bars are 95% confidence intervals

