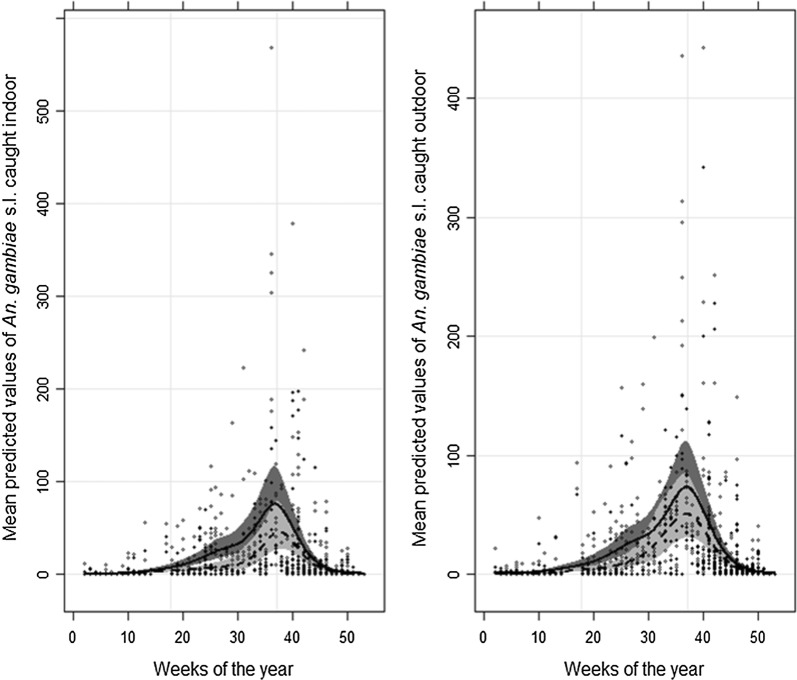
Fig. 5.
Mean predicted values of An. gambiae s.l. from a generalized additive model (GAM) with a negative binomial distribution. The full and open dots indicate respectively the observed number of An. gambiae s.l.in mosquito electrocuting trap and human landing catch through the course year indoors (left panel) and outdoors (right panel). The grey areas are the 95% confidence bands for the splines. The solid line and the dark grey indicate the data from HLC whilst the dashed-line and the light grey represents the MET. Week “1” represents the first week of January, with weeks running consecutively up to week 52 (last week of December)

