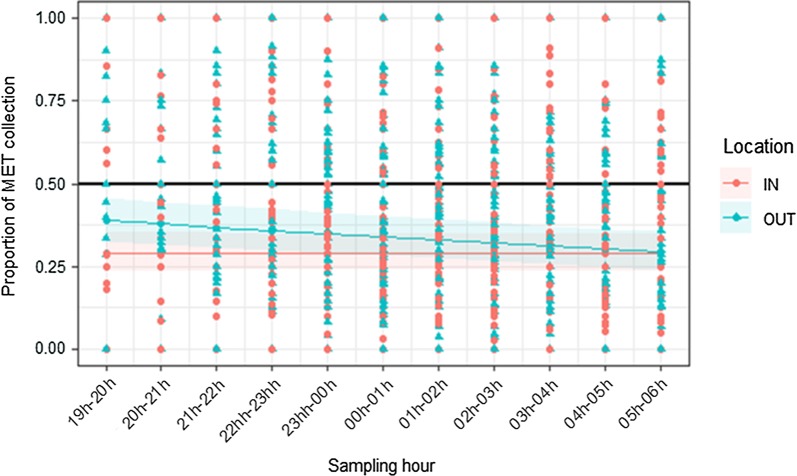
Fig. 6.
Mean proportion of An. gambiae s.l. caught in mosquito electrocuting trap (MET) collections relative to the human landing catch (HLC) over the course of the night (7 p.m.–6 a.m.). The red dots and blue triangles indicate the ratio MET/(MET + HLC) from the actual raw data respectively collected at indoor and outdoor sampling points. The black solid line indicates the scenario in which MET and HLC catch rates were equivalent. The red and blue lines represent the predicted regression line from models fit on data collected inside houses (IN) and outdoors (OUT). The shaded areas around the predicted lines represent 95% confidence intervals

